| __timestamp | Analog Devices, Inc. | KLA Corporation |
|---|---|---|
| Wednesday, January 1, 2014 | 943421000 | 855142000 |
| Thursday, January 1, 2015 | 1059384000 | 773476000 |
| Friday, January 1, 2016 | 1255468000 | 1036277000 |
| Sunday, January 1, 2017 | 1665464000 | 1276261000 |
| Monday, January 1, 2018 | 2706642000 | 1599878000 |
| Tuesday, January 1, 2019 | 2527491000 | 1620873000 |
| Wednesday, January 1, 2020 | 2317701000 | 2104221000 |
| Friday, January 1, 2021 | 2600723000 | 2851117000 |
| Saturday, January 1, 2022 | 5611579000 | 4012920000 |
| Sunday, January 1, 2023 | 6150827000 | 4406901000 |
| Monday, January 1, 2024 | 2032798000 | 3906779000 |
Unlocking the unknown
In the ever-evolving landscape of the semiconductor industry, understanding financial health is crucial. This analysis delves into the EBITDA trends of two industry giants, Analog Devices, Inc. and KLA Corporation, from 2014 to 2024. Over this decade, Analog Devices, Inc. demonstrated a remarkable growth trajectory, with EBITDA surging by over 550% from 2014 to 2023. In contrast, KLA Corporation experienced a robust yet more modest increase of approximately 415% during the same period.
The year 2022 marked a significant milestone for both companies, with Analog Devices, Inc. achieving its highest EBITDA, nearly doubling its 2021 figures. Meanwhile, KLA Corporation also reached a peak, reflecting the industry's resilience amidst global challenges. However, projections for 2024 suggest a potential decline for Analog Devices, Inc., while KLA Corporation maintains a steady performance. This analysis underscores the dynamic nature of the semiconductor sector and the strategic maneuvers of its key players.
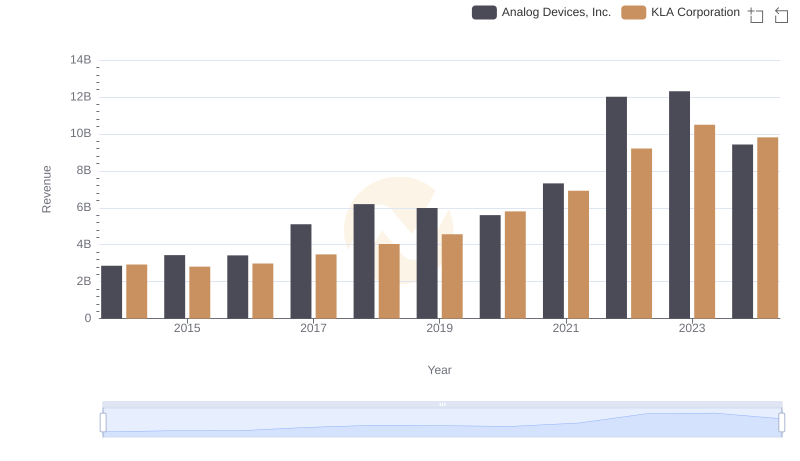
Analog Devices, Inc. or KLA Corporation: Who Leads in Yearly Revenue?
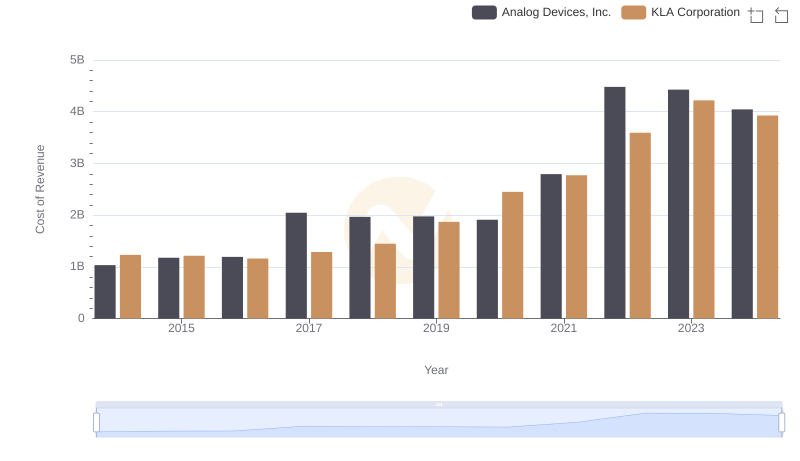
Cost of Revenue Comparison: Analog Devices, Inc. vs KLA Corporation
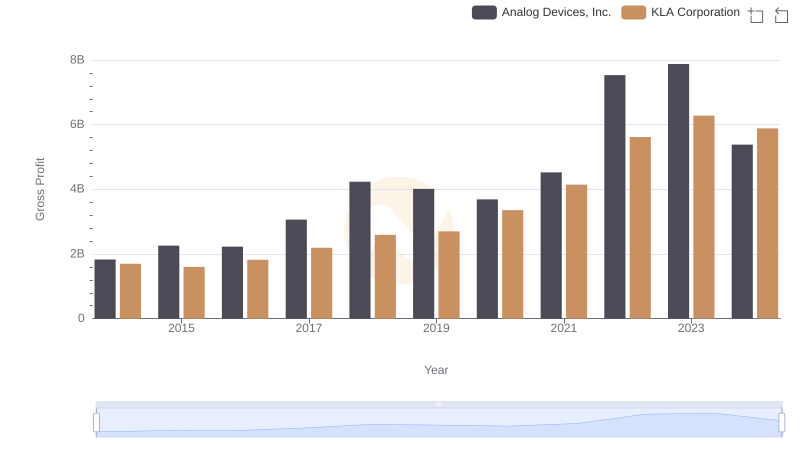
Key Insights on Gross Profit: Analog Devices, Inc. vs KLA Corporation
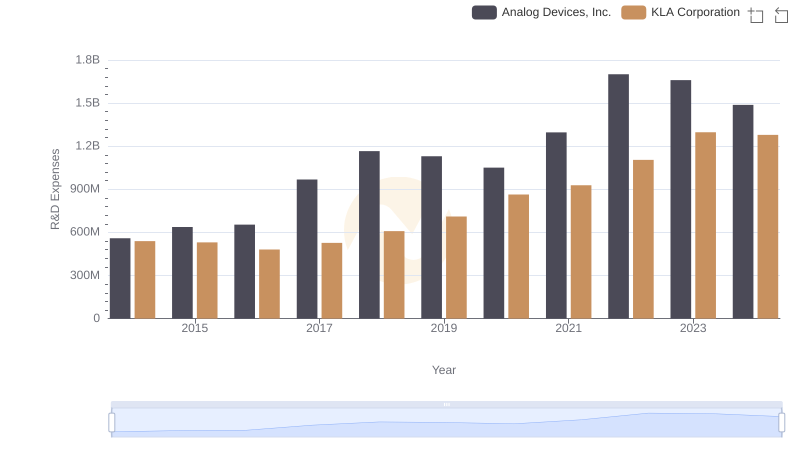
Analog Devices, Inc. or KLA Corporation: Who Invests More in Innovation?
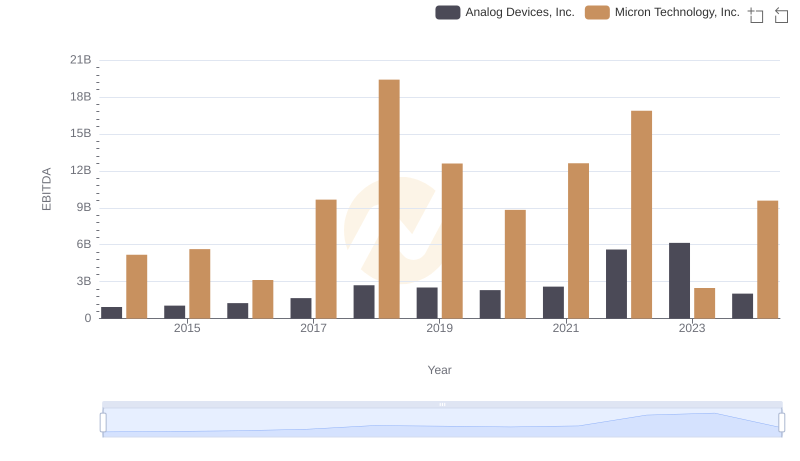
Comprehensive EBITDA Comparison: Analog Devices, Inc. vs Micron Technology, Inc.
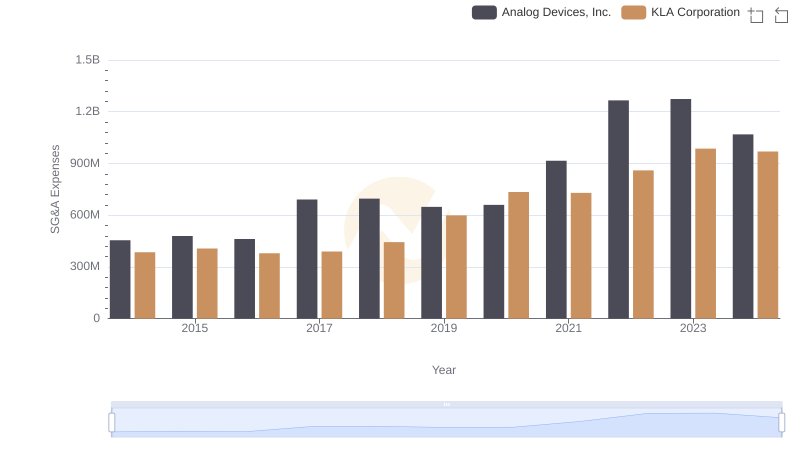
Who Optimizes SG&A Costs Better? Analog Devices, Inc. or KLA Corporation

Analog Devices, Inc. vs Lam Research Corporation: In-Depth EBITDA Performance Comparison
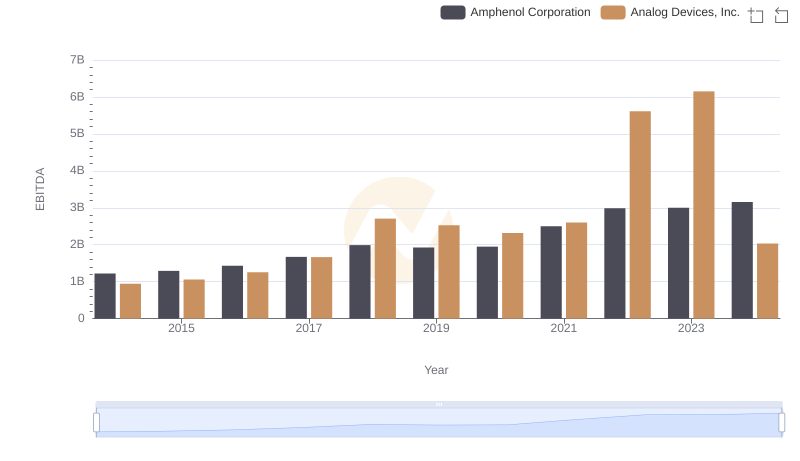
EBITDA Performance Review: Analog Devices, Inc. vs Amphenol Corporation
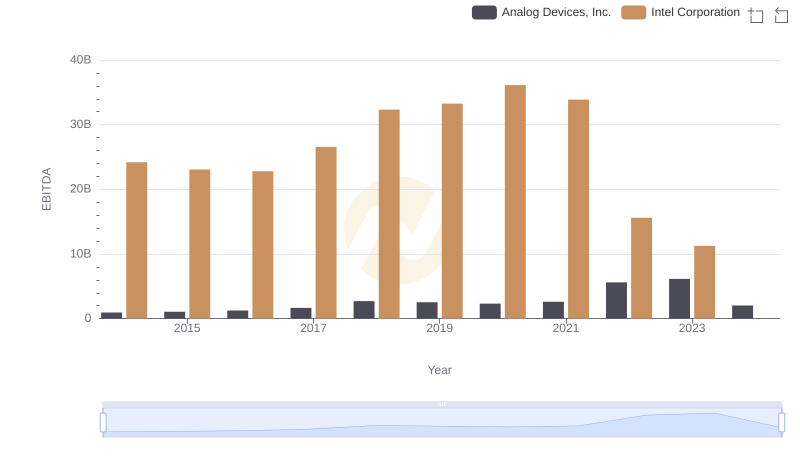
Professional EBITDA Benchmarking: Analog Devices, Inc. vs Intel Corporation
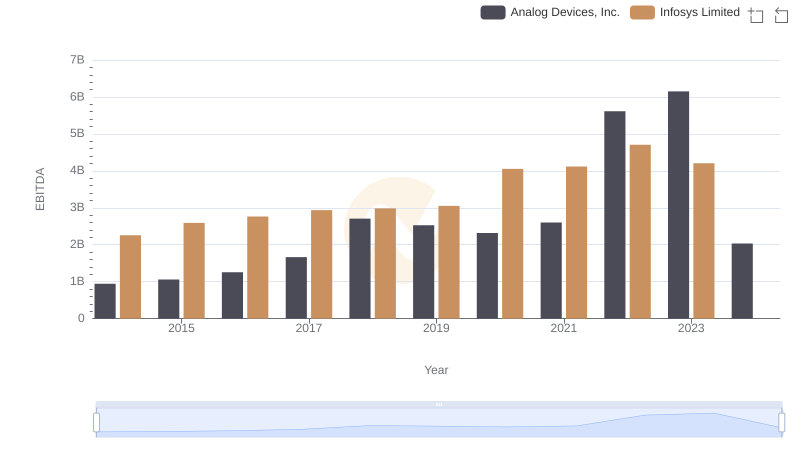
Comprehensive EBITDA Comparison: Analog Devices, Inc. vs Infosys Limited
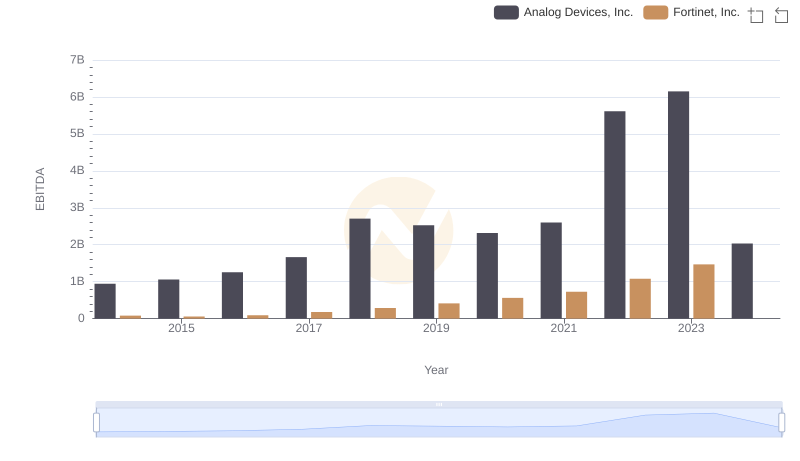
Analog Devices, Inc. and Fortinet, Inc.: A Detailed Examination of EBITDA Performance
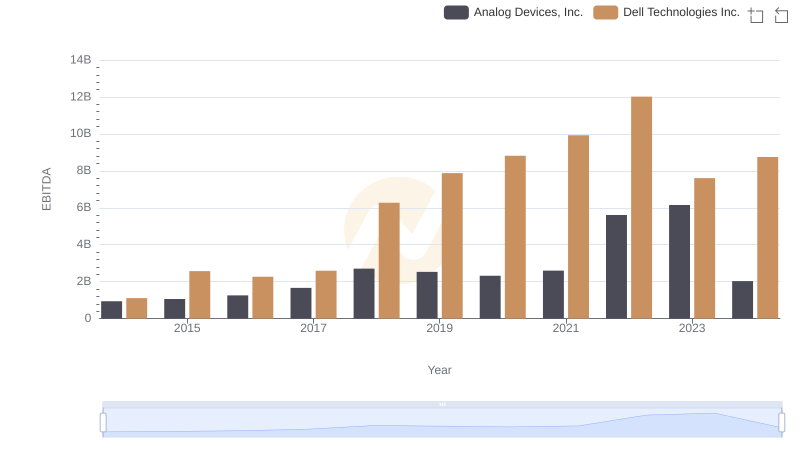
Analog Devices, Inc. vs Dell Technologies Inc.: In-Depth EBITDA Performance Comparison