| __timestamp | AMETEK, Inc. | Old Dominion Freight Line, Inc. |
|---|---|---|
| Wednesday, January 1, 2014 | 2597017000 | 2100409000 |
| Thursday, January 1, 2015 | 2549280000 | 2214943000 |
| Friday, January 1, 2016 | 2575220000 | 2246890000 |
| Sunday, January 1, 2017 | 2851431000 | 2482732000 |
| Monday, January 1, 2018 | 3186310000 | 2899452000 |
| Tuesday, January 1, 2019 | 3370897000 | 2938895000 |
| Wednesday, January 1, 2020 | 2996515000 | 2786531000 |
| Friday, January 1, 2021 | 3633900000 | 3481268000 |
| Saturday, January 1, 2022 | 4005261000 | 4003951000 |
| Sunday, January 1, 2023 | 4212484999 | 3793953000 |
| Monday, January 1, 2024 | 0 |
Unleashing the power of data
In the ever-evolving landscape of industrial and freight services, understanding cost dynamics is crucial. From 2014 to 2023, AMETEK, Inc. and Old Dominion Freight Line, Inc. have shown significant shifts in their cost of revenue. AMETEK, Inc. experienced a steady increase, with costs rising approximately 62% over the decade, peaking in 2023. This growth reflects their expanding operations and market reach. Meanwhile, Old Dominion Freight Line, Inc. saw a 81% increase in costs, highlighting their robust growth in the freight sector. Notably, both companies faced a dip in 2020, likely due to global disruptions, but rebounded strongly in subsequent years. These trends underscore the resilience and adaptability of these industry leaders in managing operational costs while navigating economic challenges.
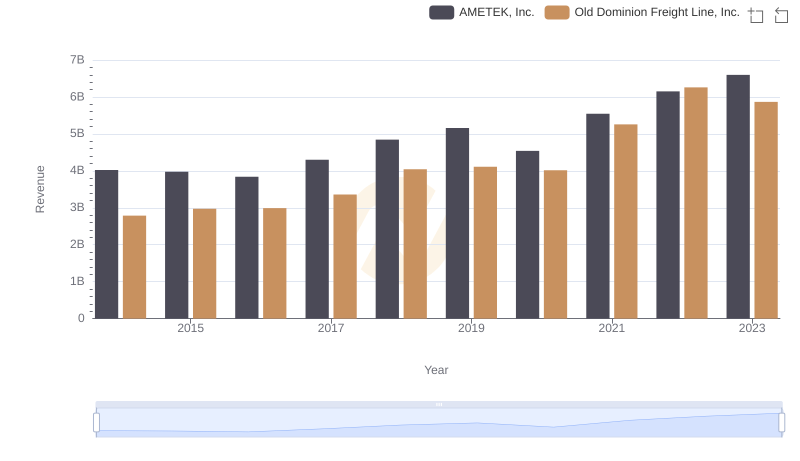
Revenue Insights: AMETEK, Inc. and Old Dominion Freight Line, Inc. Performance Compared
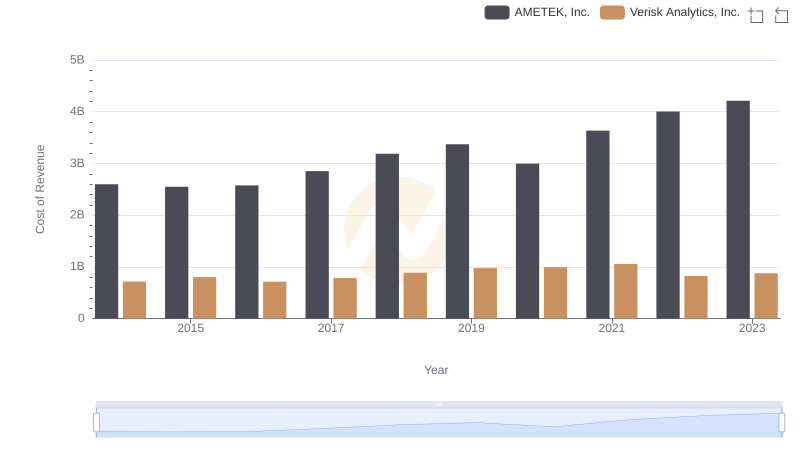
Cost of Revenue Comparison: AMETEK, Inc. vs Verisk Analytics, Inc.
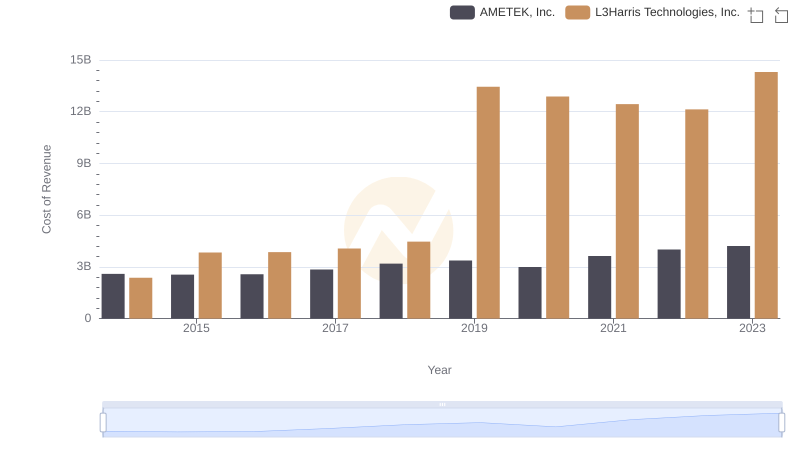
Cost Insights: Breaking Down AMETEK, Inc. and L3Harris Technologies, Inc.'s Expenses
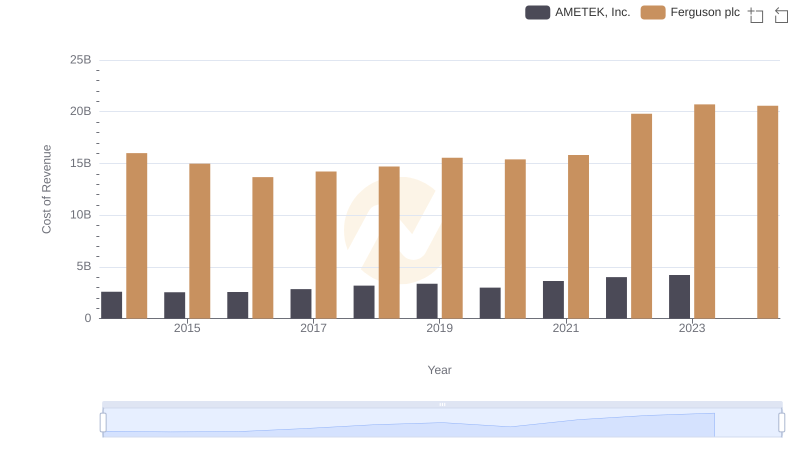
AMETEK, Inc. vs Ferguson plc: Efficiency in Cost of Revenue Explored
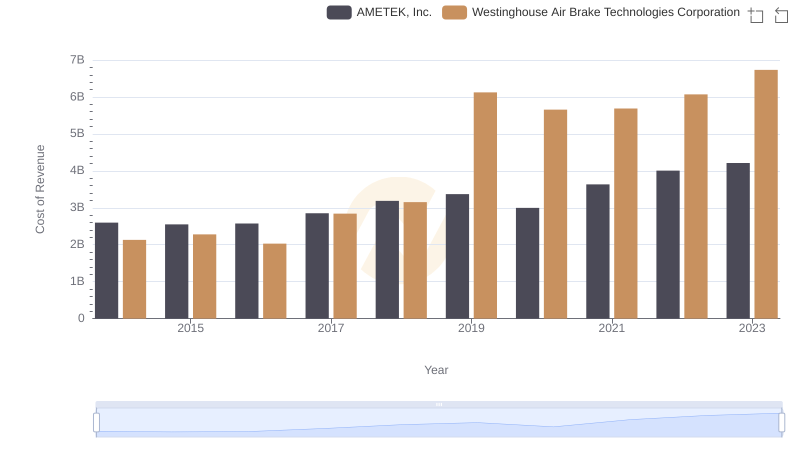
Cost Insights: Breaking Down AMETEK, Inc. and Westinghouse Air Brake Technologies Corporation's Expenses
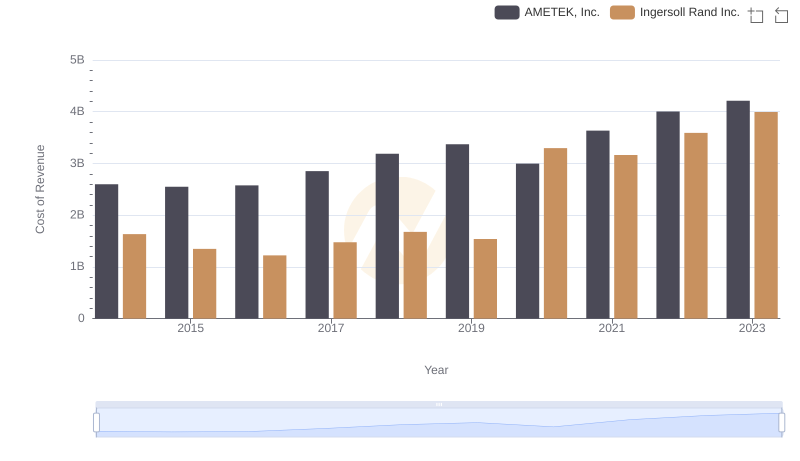
Cost of Revenue: Key Insights for AMETEK, Inc. and Ingersoll Rand Inc.
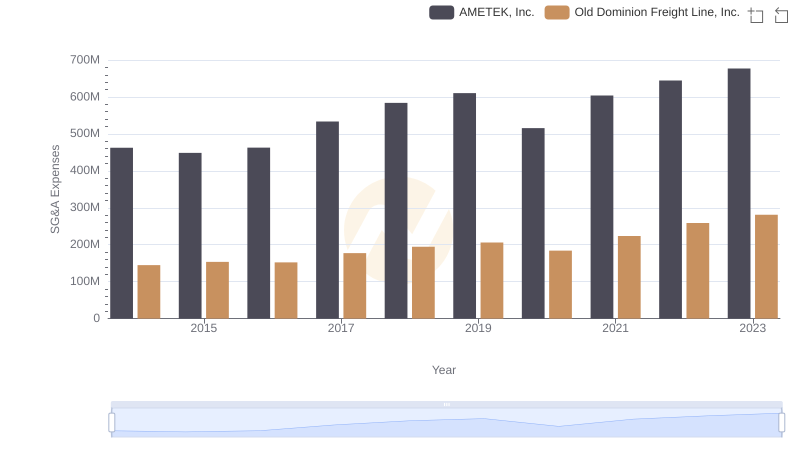
Who Optimizes SG&A Costs Better? AMETEK, Inc. or Old Dominion Freight Line, Inc.
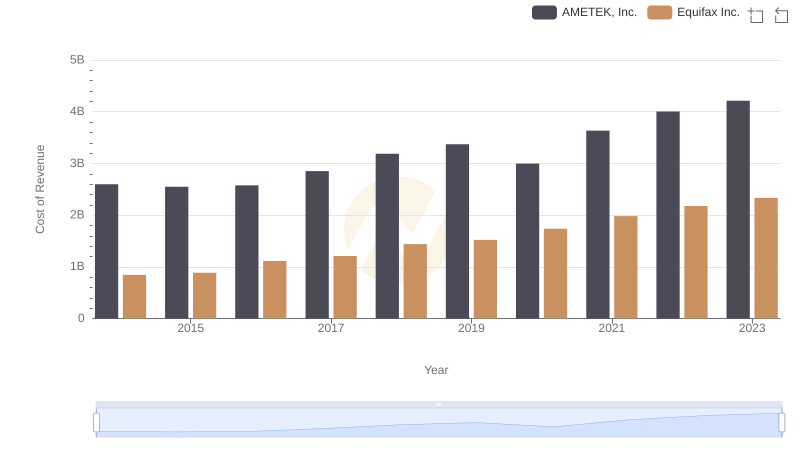
AMETEK, Inc. vs Equifax Inc.: Efficiency in Cost of Revenue Explored
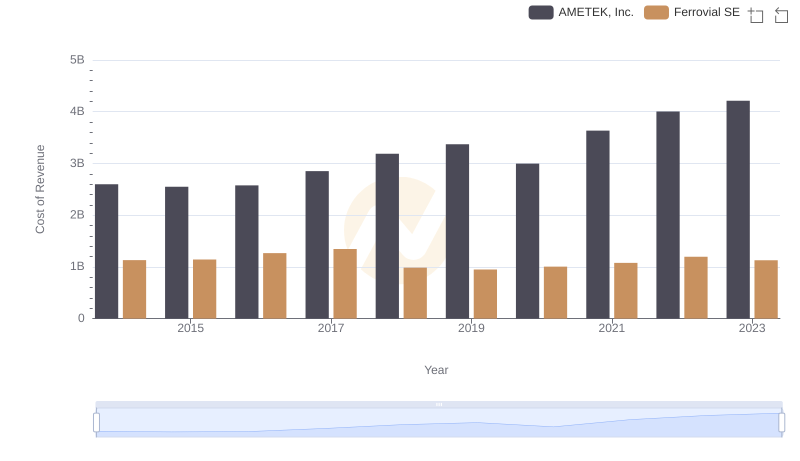
Cost of Revenue Trends: AMETEK, Inc. vs Ferrovial SE