| __timestamp | AMETEK, Inc. | Westinghouse Air Brake Technologies Corporation |
|---|---|---|
| Wednesday, January 1, 2014 | 2597017000 | 2130920000 |
| Thursday, January 1, 2015 | 2549280000 | 2281845000 |
| Friday, January 1, 2016 | 2575220000 | 2029647000 |
| Sunday, January 1, 2017 | 2851431000 | 2841159000 |
| Monday, January 1, 2018 | 3186310000 | 3151816000 |
| Tuesday, January 1, 2019 | 3370897000 | 6122400000 |
| Wednesday, January 1, 2020 | 2996515000 | 5657400000 |
| Friday, January 1, 2021 | 3633900000 | 5687000000 |
| Saturday, January 1, 2022 | 4005261000 | 6070000000 |
| Sunday, January 1, 2023 | 4212484999 | 6733000000 |
| Monday, January 1, 2024 | 0 | 7021000000 |
Infusing magic into the data realm
In the ever-evolving landscape of industrial manufacturing, understanding cost structures is pivotal. AMETEK, Inc. and Westinghouse Air Brake Technologies Corporation, two giants in the sector, have shown distinct trends in their cost of revenue over the past decade. From 2014 to 2023, AMETEK's cost of revenue increased by approximately 62%, reflecting a steady growth trajectory. In contrast, Westinghouse Air Brake Technologies Corporation experienced a more dramatic rise of about 216% during the same period, indicating significant operational expansions or increased production costs.
These trends highlight the dynamic nature of cost management in industrial sectors, offering valuable insights for investors and industry analysts.
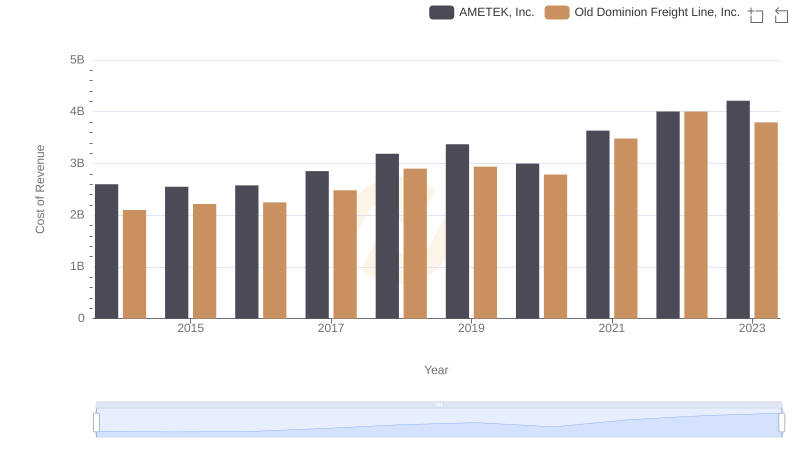
Cost of Revenue: Key Insights for AMETEK, Inc. and Old Dominion Freight Line, Inc.
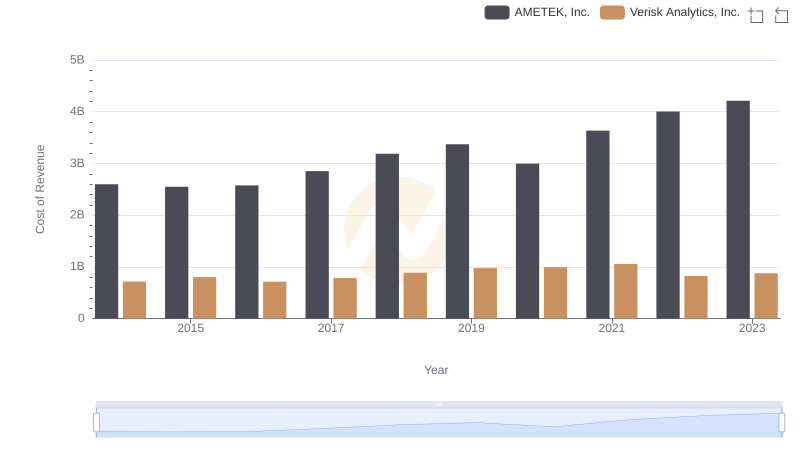
Cost of Revenue Comparison: AMETEK, Inc. vs Verisk Analytics, Inc.
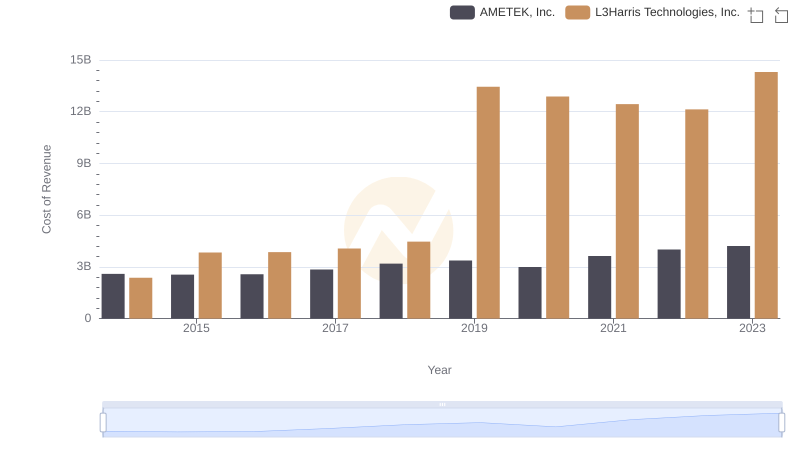
Cost Insights: Breaking Down AMETEK, Inc. and L3Harris Technologies, Inc.'s Expenses
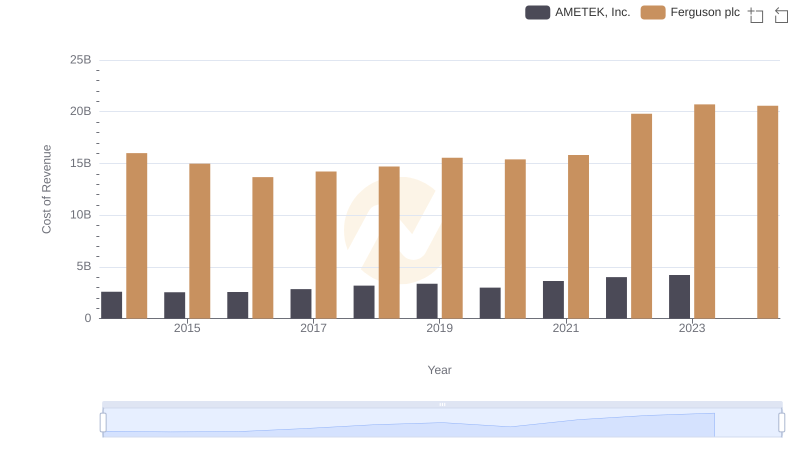
AMETEK, Inc. vs Ferguson plc: Efficiency in Cost of Revenue Explored
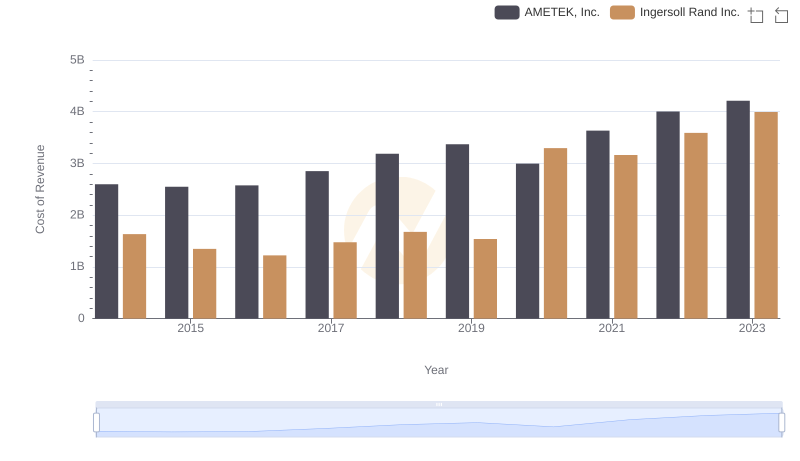
Cost of Revenue: Key Insights for AMETEK, Inc. and Ingersoll Rand Inc.
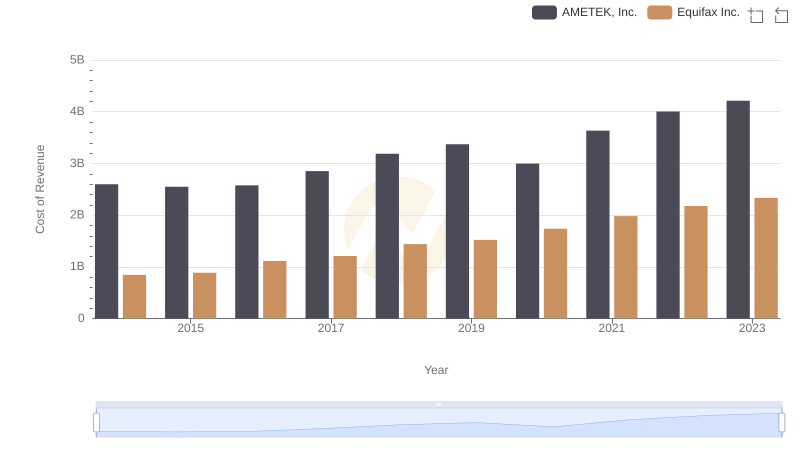
AMETEK, Inc. vs Equifax Inc.: Efficiency in Cost of Revenue Explored
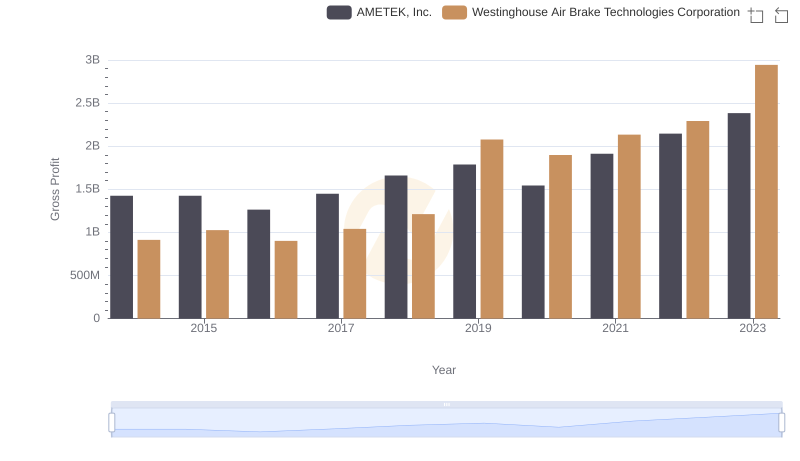
Gross Profit Trends Compared: AMETEK, Inc. vs Westinghouse Air Brake Technologies Corporation
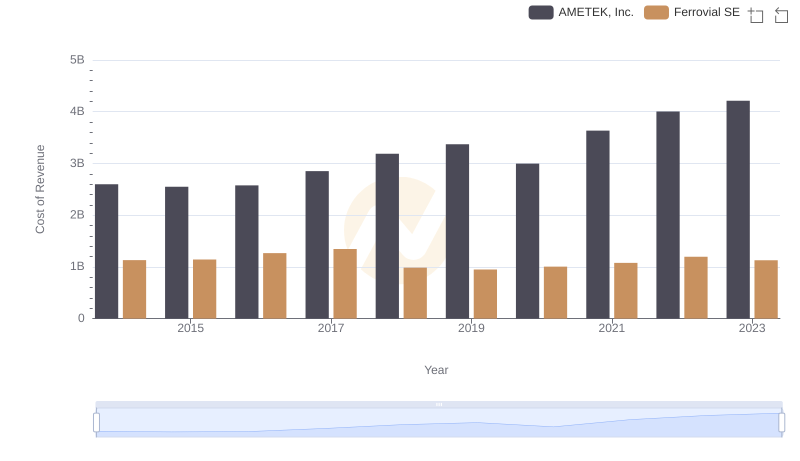
Cost of Revenue Trends: AMETEK, Inc. vs Ferrovial SE
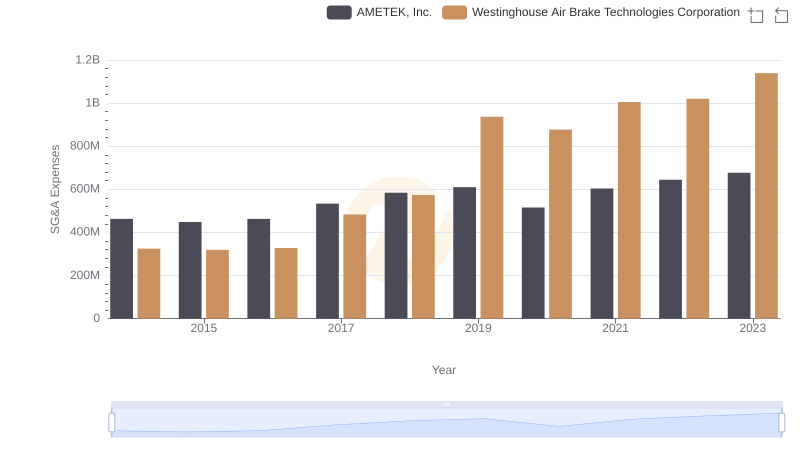
Selling, General, and Administrative Costs: AMETEK, Inc. vs Westinghouse Air Brake Technologies Corporation
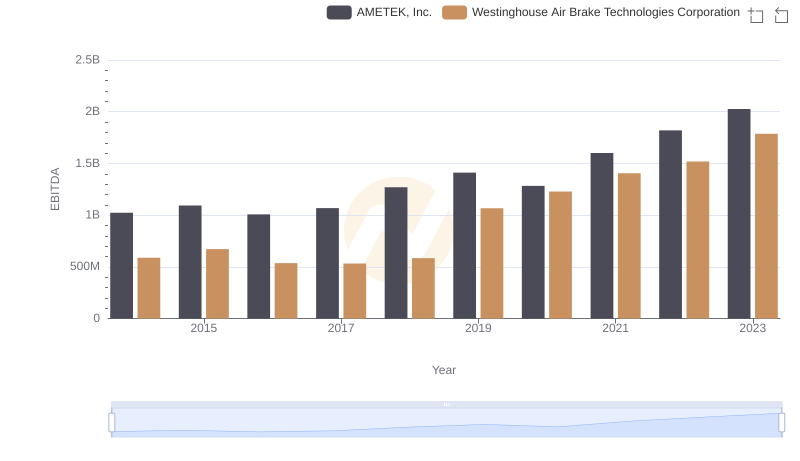
A Professional Review of EBITDA: AMETEK, Inc. Compared to Westinghouse Air Brake Technologies Corporation