| __timestamp | Infosys Limited | Wipro Limited |
|---|---|---|
| Wednesday, January 1, 2014 | 2258000000 | 128105000000 |
| Thursday, January 1, 2015 | 2590000000 | 107958000000 |
| Friday, January 1, 2016 | 2765000000 | 133082000000 |
| Sunday, January 1, 2017 | 2936000000 | 126406000000 |
| Monday, January 1, 2018 | 2984000000 | 114648000000 |
| Tuesday, January 1, 2019 | 3053000000 | 122279000000 |
| Wednesday, January 1, 2020 | 4053342784 | 168413000000 |
| Friday, January 1, 2021 | 4116000000 | 165303000000 |
| Saturday, January 1, 2022 | 4707334610 | 189377000000 |
| Sunday, January 1, 2023 | 4206000000 | 193833000000 |
| Monday, January 1, 2024 | 193833000000 |
Unleashing insights
In the ever-evolving landscape of the Indian IT sector, Infosys Limited and Wipro Limited have been titans of industry. Over the past decade, from 2014 to 2023, these two giants have showcased contrasting trajectories in their EBITDA performance.
Infosys, with a steady growth pattern, saw its EBITDA rise by approximately 86% from 2014 to 2023, peaking in 2022. This growth reflects Infosys's strategic initiatives and robust operational efficiencies. On the other hand, Wipro's EBITDA, although significantly higher in absolute terms, exhibited a more volatile trend, with a notable surge of around 51% during the same period, reaching its zenith in 2023.
The data highlights a fascinating narrative of resilience and adaptation, with Infosys maintaining a consistent upward trend, while Wipro's larger EBITDA figures underscore its expansive market reach. However, the absence of Infosys's data for 2024 leaves room for speculation on its future trajectory.
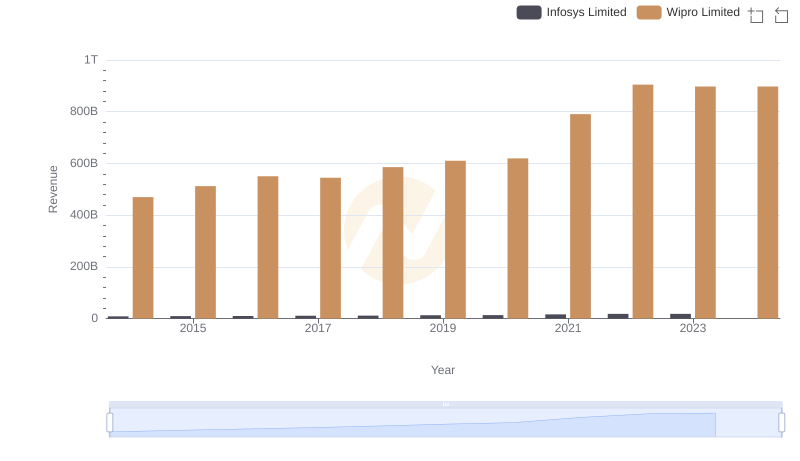
Infosys Limited vs Wipro Limited: Examining Key Revenue Metrics
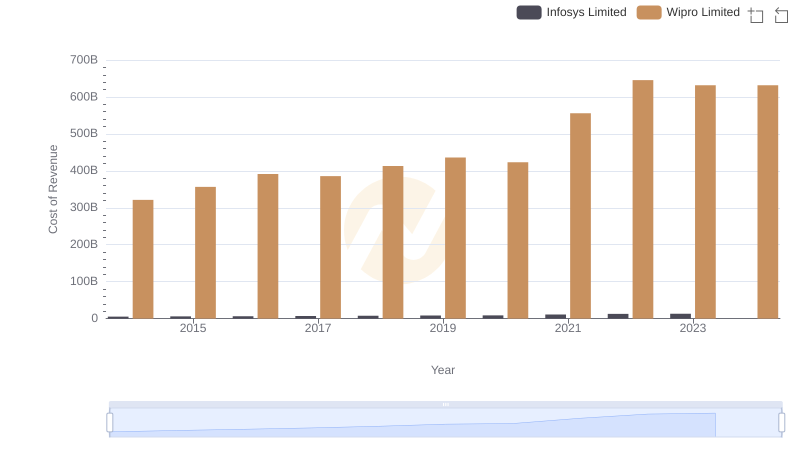
Comparing Cost of Revenue Efficiency: Infosys Limited vs Wipro Limited
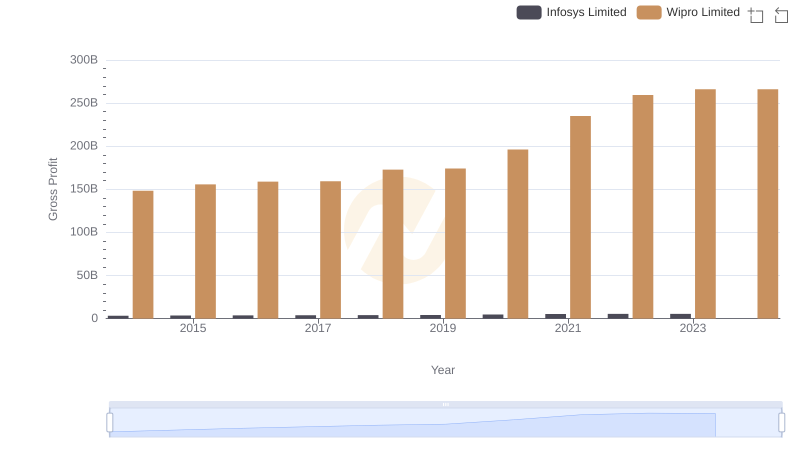
Gross Profit Trends Compared: Infosys Limited vs Wipro Limited
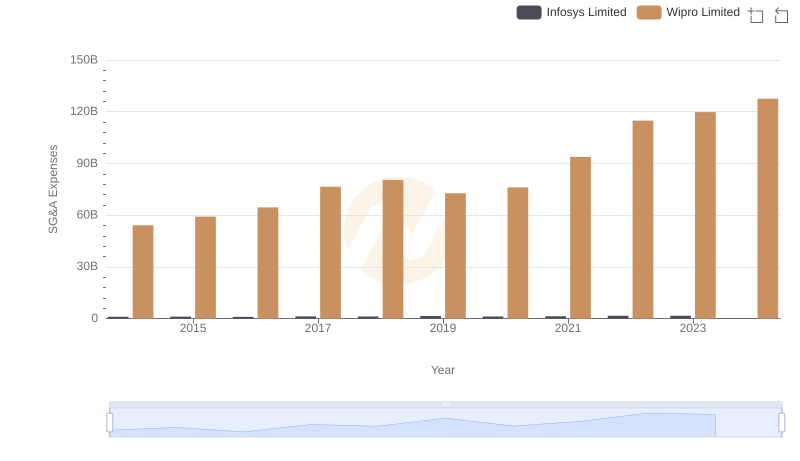
Cost Management Insights: SG&A Expenses for Infosys Limited and Wipro Limited
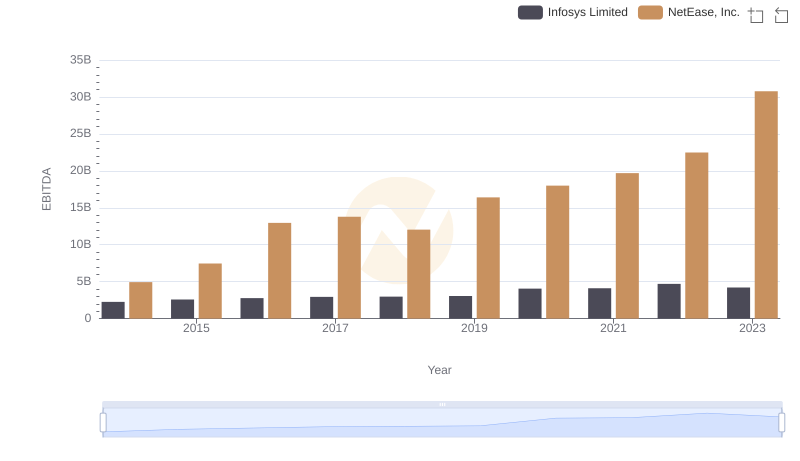
A Side-by-Side Analysis of EBITDA: Infosys Limited and NetEase, Inc.
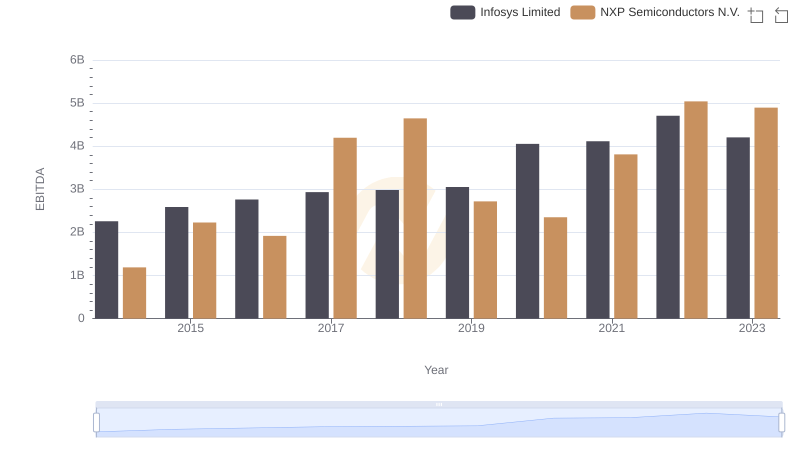
EBITDA Metrics Evaluated: Infosys Limited vs NXP Semiconductors N.V.
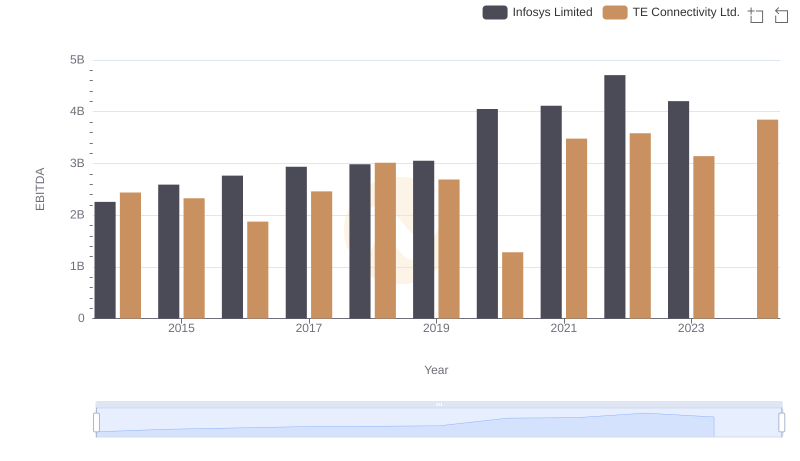
Professional EBITDA Benchmarking: Infosys Limited vs TE Connectivity Ltd.
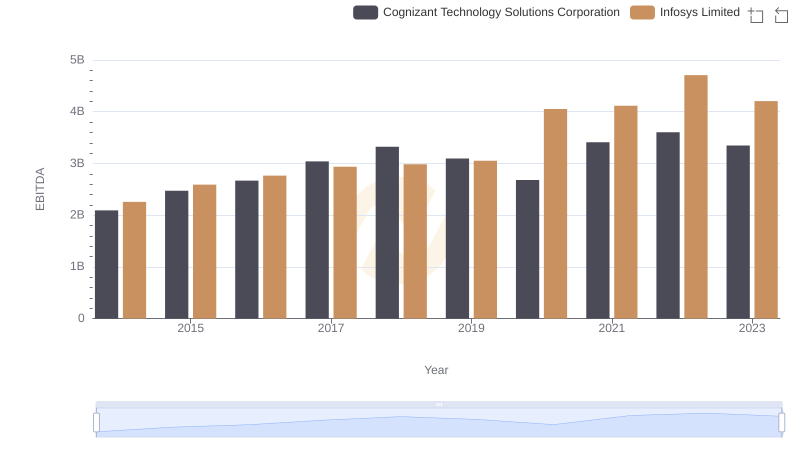
Professional EBITDA Benchmarking: Infosys Limited vs Cognizant Technology Solutions Corporation
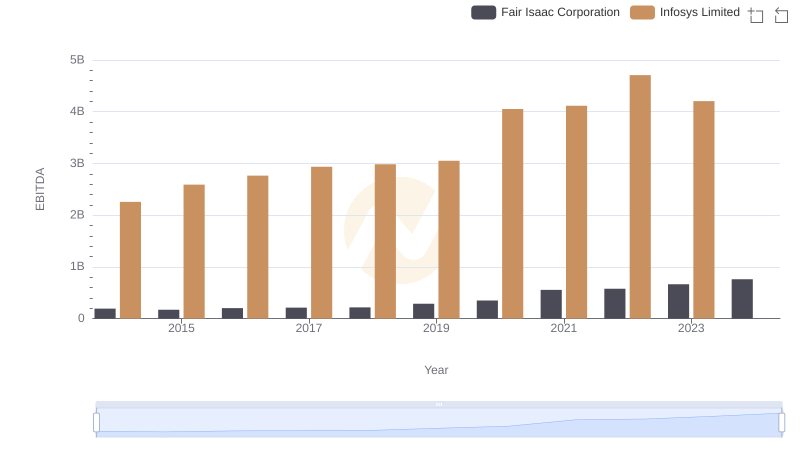
A Side-by-Side Analysis of EBITDA: Infosys Limited and Fair Isaac Corporation
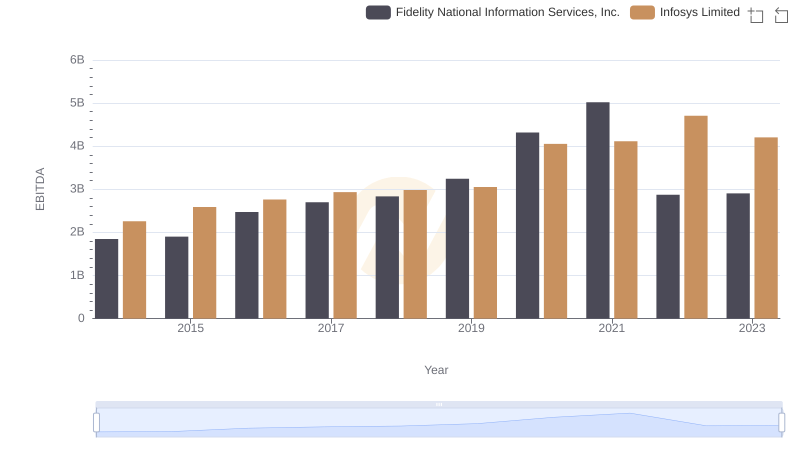
A Professional Review of EBITDA: Infosys Limited Compared to Fidelity National Information Services, Inc.
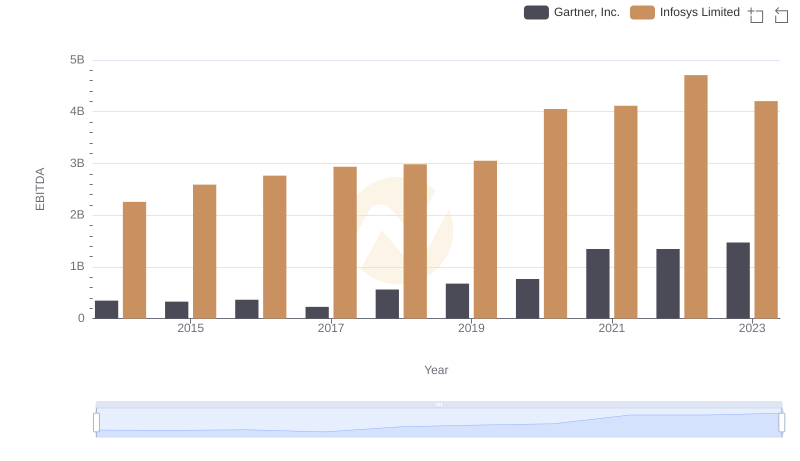
A Side-by-Side Analysis of EBITDA: Infosys Limited and Gartner, Inc.
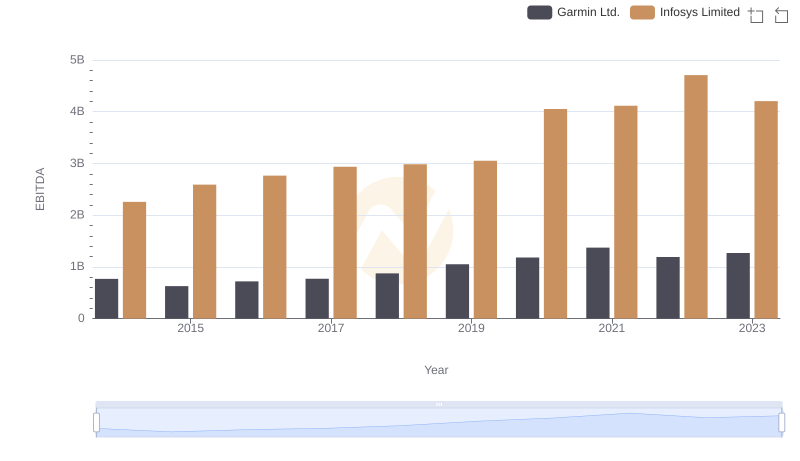
EBITDA Analysis: Evaluating Infosys Limited Against Garmin Ltd.