| __timestamp | Adobe Inc. | Cisco Systems, Inc. |
|---|---|---|
| Wednesday, January 1, 2014 | 2215140000 | 11437000000 |
| Thursday, January 1, 2015 | 2215161000 | 11861000000 |
| Friday, January 1, 2016 | 2487907000 | 11433000000 |
| Sunday, January 1, 2017 | 2822298000 | 11177000000 |
| Monday, January 1, 2018 | 3365727000 | 11386000000 |
| Tuesday, January 1, 2019 | 4124984000 | 11398000000 |
| Wednesday, January 1, 2020 | 4559000000 | 11094000000 |
| Friday, January 1, 2021 | 5406000000 | 11411000000 |
| Saturday, January 1, 2022 | 6187000000 | 11186000000 |
| Sunday, January 1, 2023 | 6764000000 | 12358000000 |
| Monday, January 1, 2024 | 7293000000 | 13177000000 |
Unleashing insights
In the ever-evolving tech industry, understanding financial trends is crucial. Over the past decade, from 2014 to 2024, Cisco Systems, Inc. and Adobe Inc. have shown distinct trajectories in their Selling, General, and Administrative (SG&A) expenses. Adobe's SG&A expenses have surged by approximately 230%, reflecting its aggressive growth strategy and expansion into new markets. In contrast, Cisco's expenses have increased by about 15%, indicating a more stable approach. Notably, in 2023, Cisco's SG&A expenses spiked by 10% compared to the previous year, possibly due to strategic investments or acquisitions. Meanwhile, Adobe's consistent rise in expenses underscores its commitment to innovation and market leadership. These trends offer a window into each company's operational priorities and strategic directions, providing valuable insights for investors and industry analysts alike.
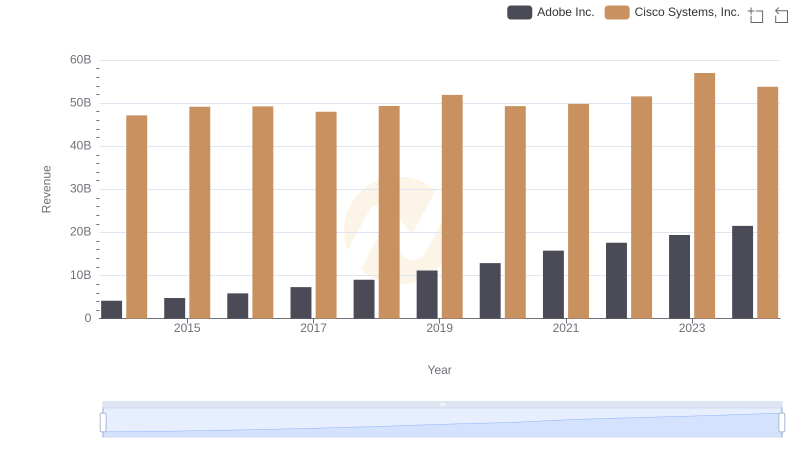
Cisco Systems, Inc. vs Adobe Inc.: Examining Key Revenue Metrics
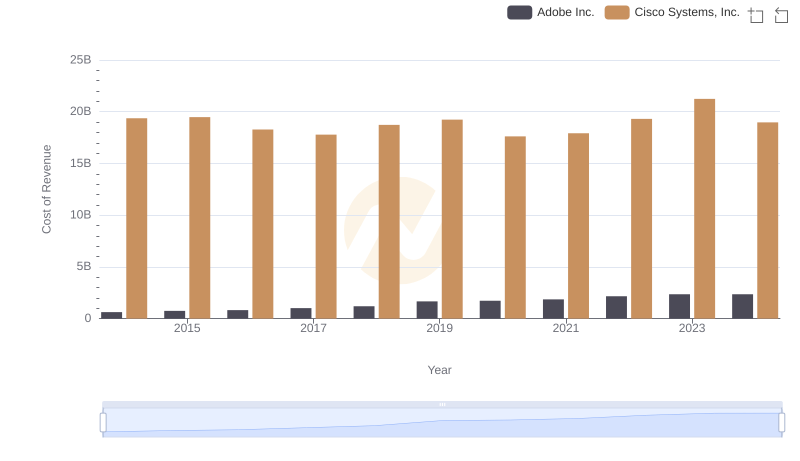
Comparing Cost of Revenue Efficiency: Cisco Systems, Inc. vs Adobe Inc.
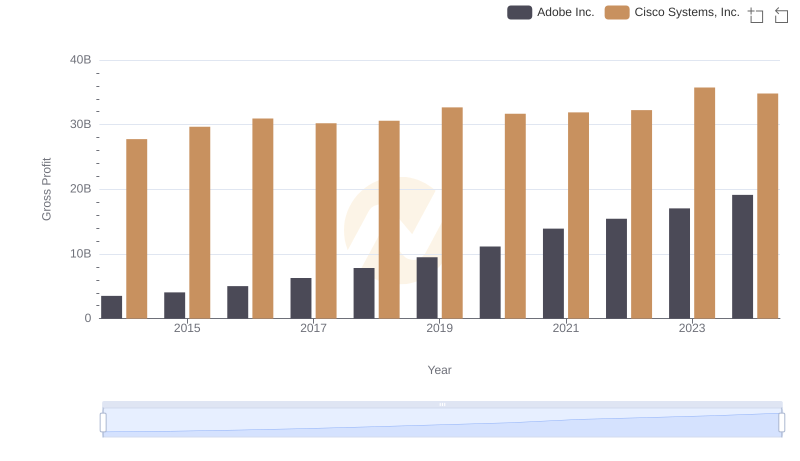
Key Insights on Gross Profit: Cisco Systems, Inc. vs Adobe Inc.
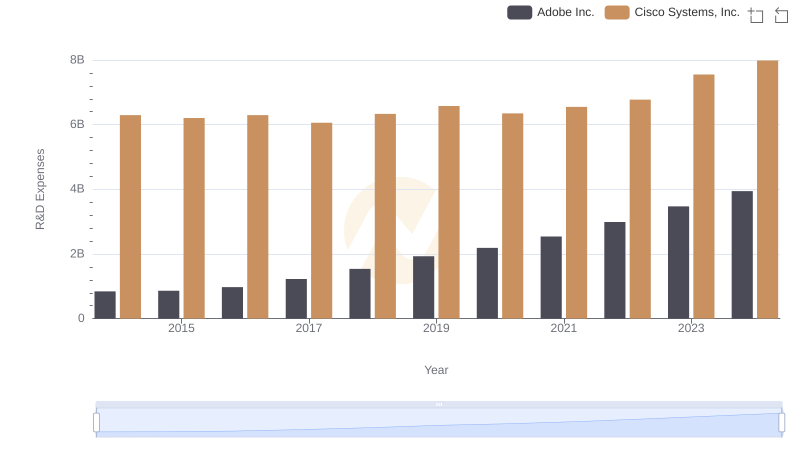
Cisco Systems, Inc. vs Adobe Inc.: Strategic Focus on R&D Spending
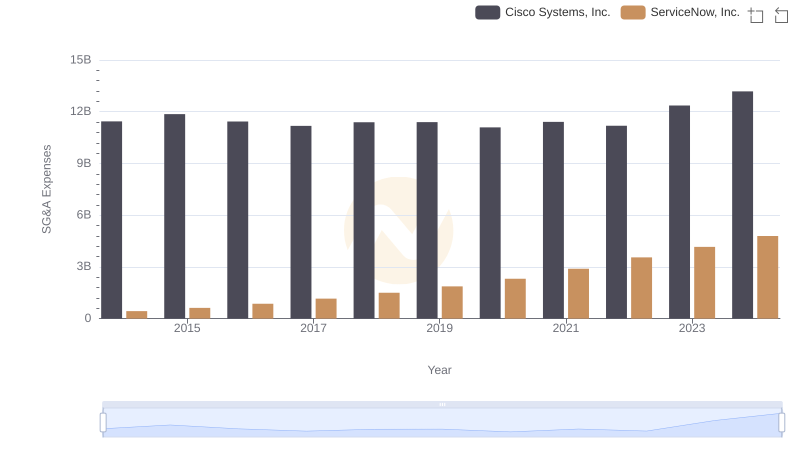
Cost Management Insights: SG&A Expenses for Cisco Systems, Inc. and ServiceNow, Inc.
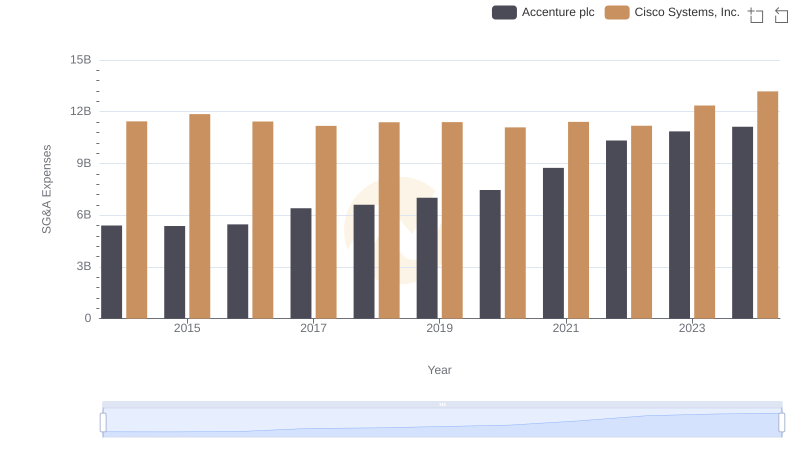
Cisco Systems, Inc. vs Accenture plc: SG&A Expense Trends
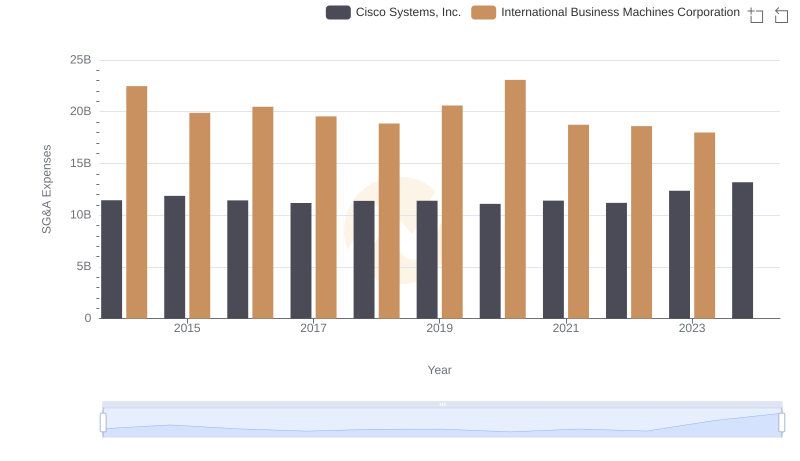
Breaking Down SG&A Expenses: Cisco Systems, Inc. vs International Business Machines Corporation
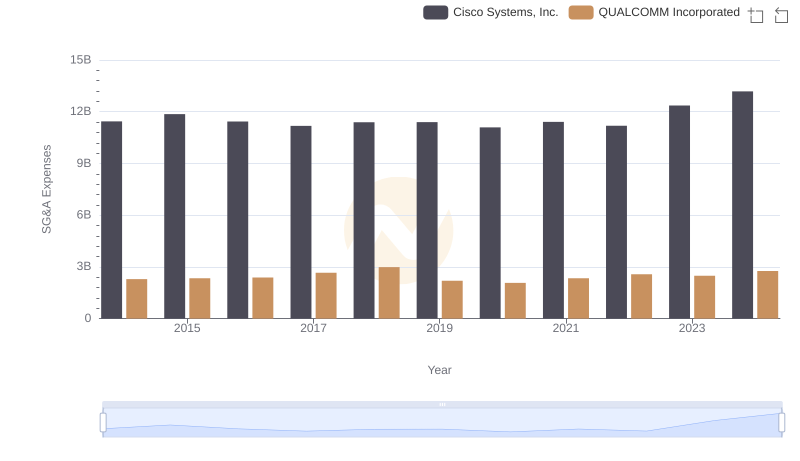
SG&A Efficiency Analysis: Comparing Cisco Systems, Inc. and QUALCOMM Incorporated
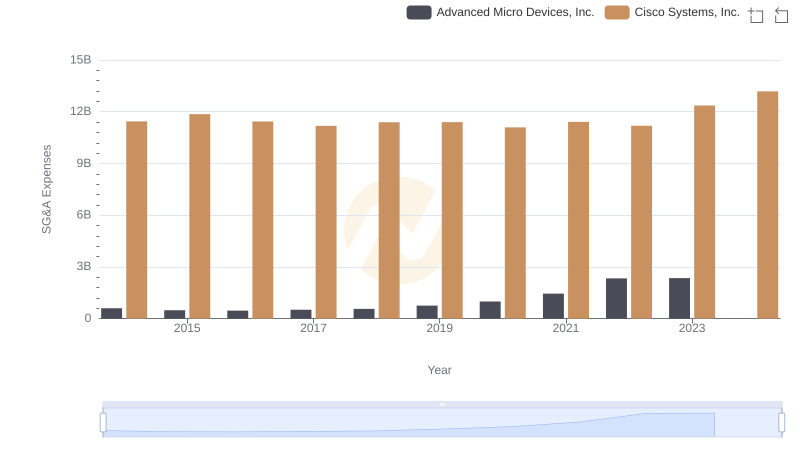
SG&A Efficiency Analysis: Comparing Cisco Systems, Inc. and Advanced Micro Devices, Inc.
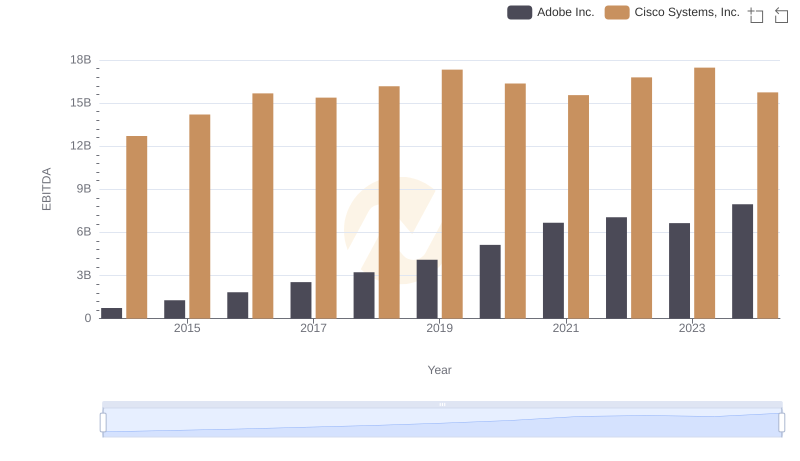
A Professional Review of EBITDA: Cisco Systems, Inc. Compared to Adobe Inc.
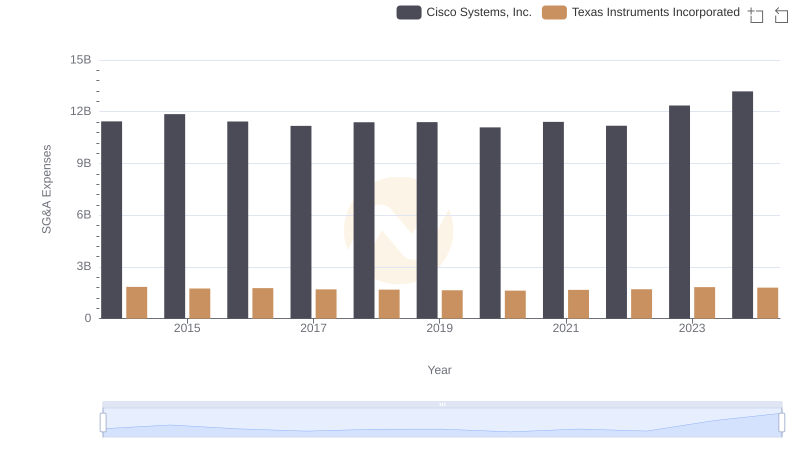
Cisco Systems, Inc. or Texas Instruments Incorporated: Who Manages SG&A Costs Better?
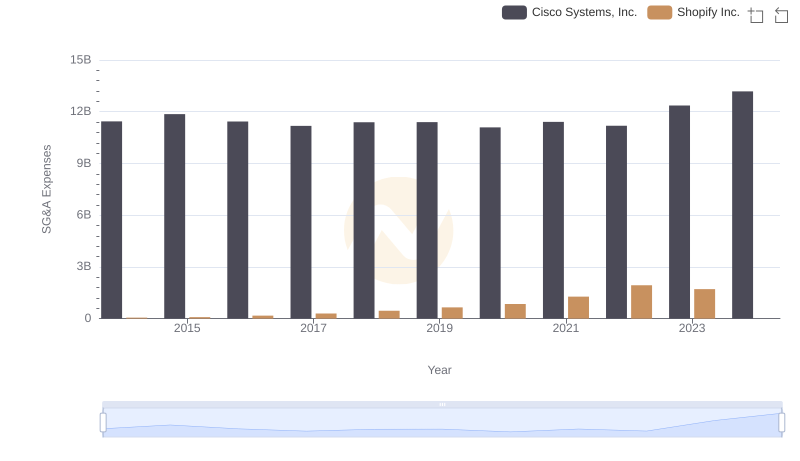
Cisco Systems, Inc. and Shopify Inc.: SG&A Spending Patterns Compared