| __timestamp | Accenture plc | Cisco Systems, Inc. |
|---|---|---|
| Wednesday, January 1, 2014 | 5401969000 | 11437000000 |
| Thursday, January 1, 2015 | 5373370000 | 11861000000 |
| Friday, January 1, 2016 | 5466982000 | 11433000000 |
| Sunday, January 1, 2017 | 6397883000 | 11177000000 |
| Monday, January 1, 2018 | 6601872000 | 11386000000 |
| Tuesday, January 1, 2019 | 7009614000 | 11398000000 |
| Wednesday, January 1, 2020 | 7462514000 | 11094000000 |
| Friday, January 1, 2021 | 8742599000 | 11411000000 |
| Saturday, January 1, 2022 | 10334358000 | 11186000000 |
| Sunday, January 1, 2023 | 10858572000 | 12358000000 |
| Monday, January 1, 2024 | 11128030000 | 13177000000 |
In pursuit of knowledge
In the ever-evolving tech landscape, understanding the financial strategies of industry giants like Cisco Systems, Inc. and Accenture plc is crucial. Over the past decade, from 2014 to 2024, both companies have shown distinct trends in their Selling, General, and Administrative (SG&A) expenses. Cisco's SG&A expenses have consistently been higher, peaking in 2024 with a 15% increase from 2023. Meanwhile, Accenture has demonstrated a remarkable growth trajectory, with a 106% increase in SG&A expenses from 2014 to 2024. This trend reflects Accenture's aggressive expansion and investment in operational capabilities. The data highlights a strategic divergence: while Cisco maintains a steady approach, Accenture is rapidly scaling its operations. These insights provide a window into the strategic priorities of these tech titans, offering valuable lessons for investors and industry watchers alike.
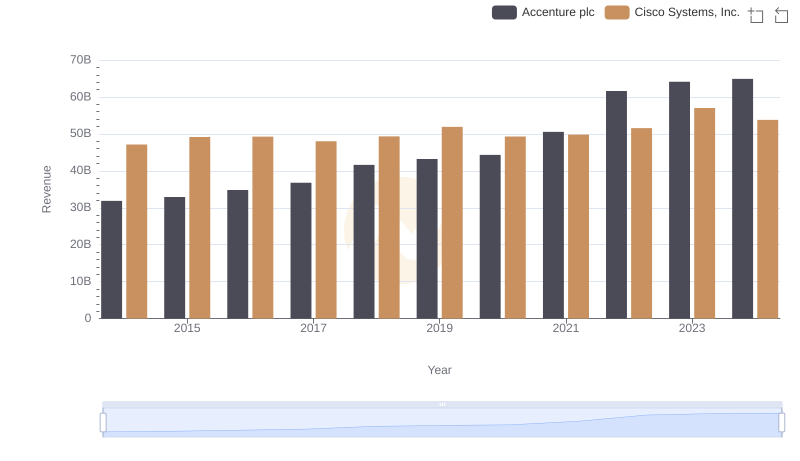
Cisco Systems, Inc. vs Accenture plc: Examining Key Revenue Metrics
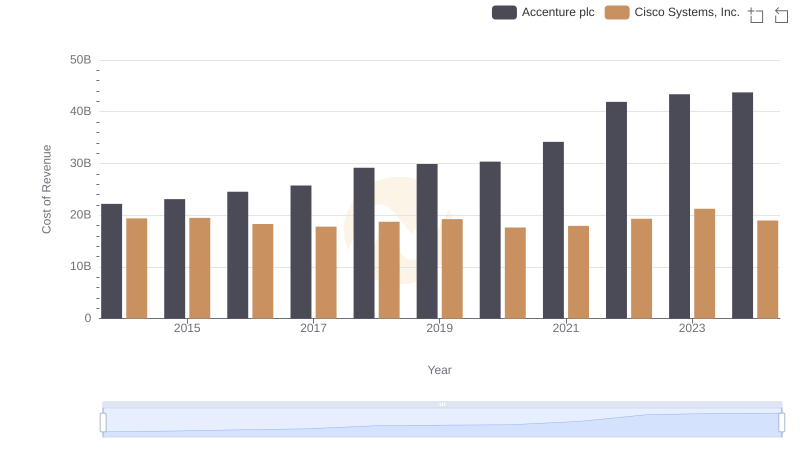
Analyzing Cost of Revenue: Cisco Systems, Inc. and Accenture plc
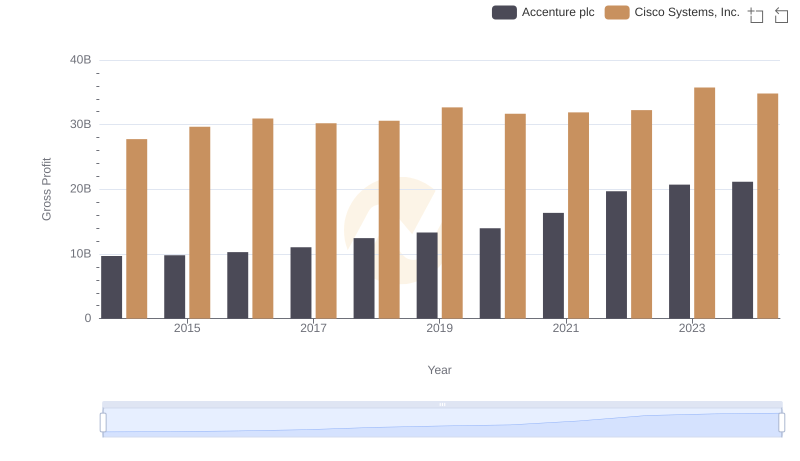
Cisco Systems, Inc. and Accenture plc: A Detailed Gross Profit Analysis
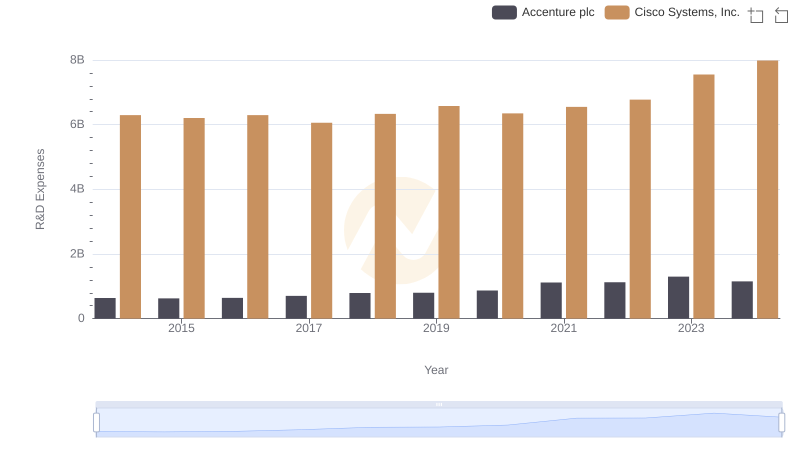
Cisco Systems, Inc. or Accenture plc: Who Invests More in Innovation?
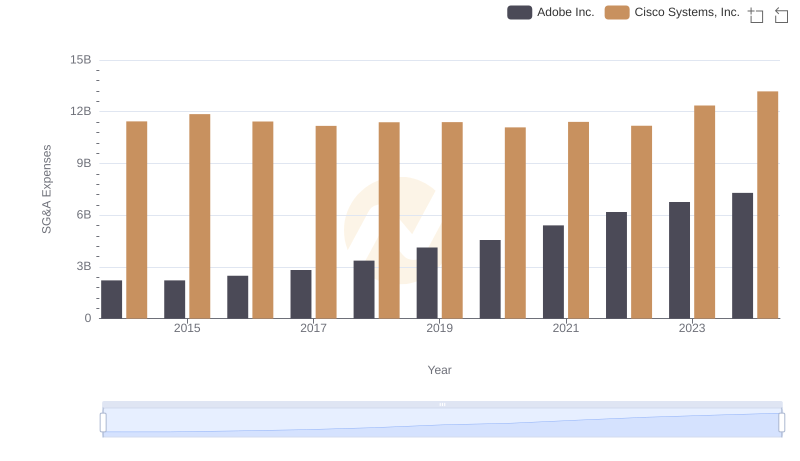
Cisco Systems, Inc. vs Adobe Inc.: SG&A Expense Trends
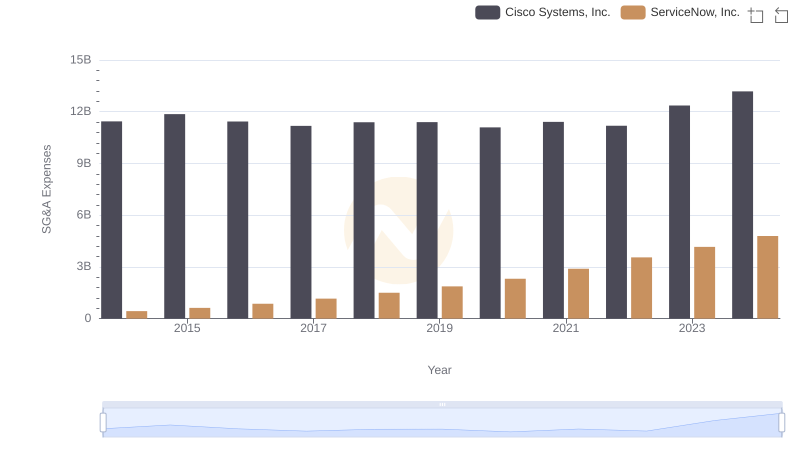
Cost Management Insights: SG&A Expenses for Cisco Systems, Inc. and ServiceNow, Inc.
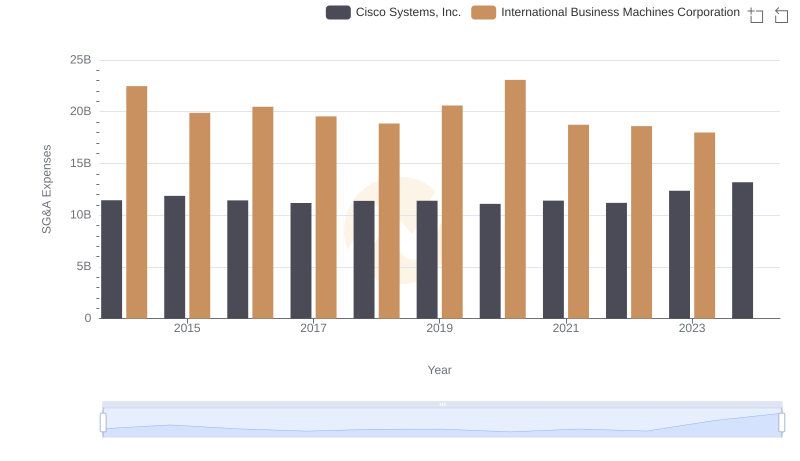
Breaking Down SG&A Expenses: Cisco Systems, Inc. vs International Business Machines Corporation
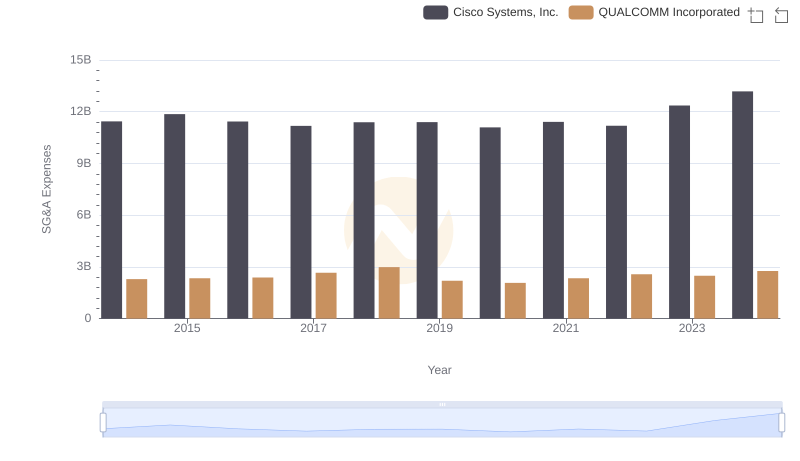
SG&A Efficiency Analysis: Comparing Cisco Systems, Inc. and QUALCOMM Incorporated
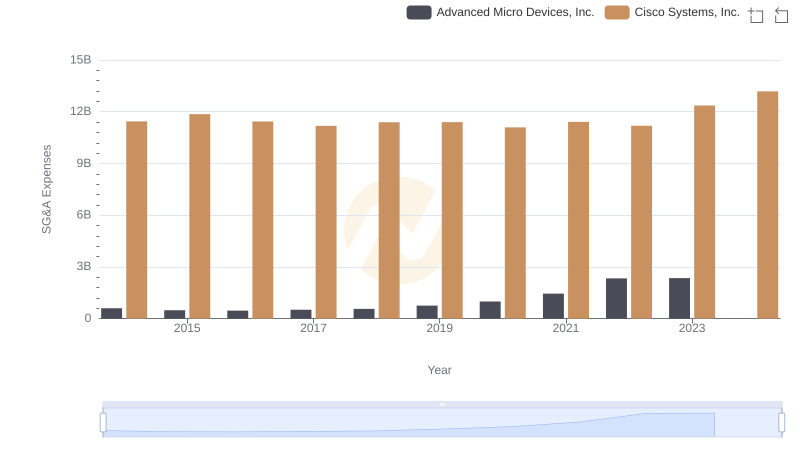
SG&A Efficiency Analysis: Comparing Cisco Systems, Inc. and Advanced Micro Devices, Inc.
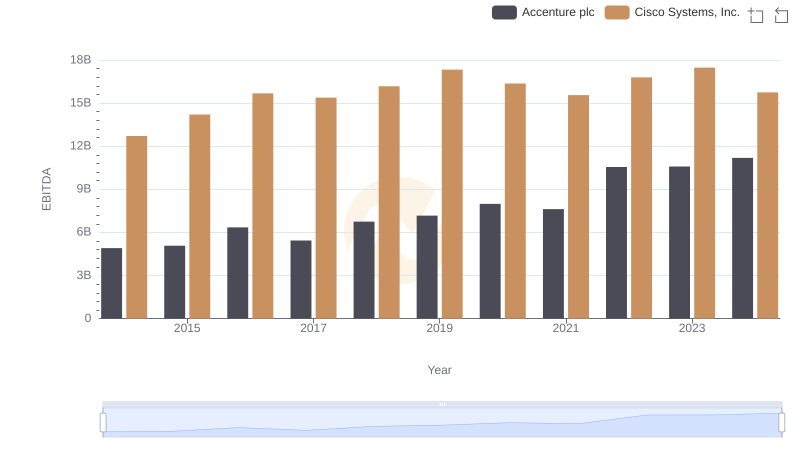
Cisco Systems, Inc. vs Accenture plc: In-Depth EBITDA Performance Comparison
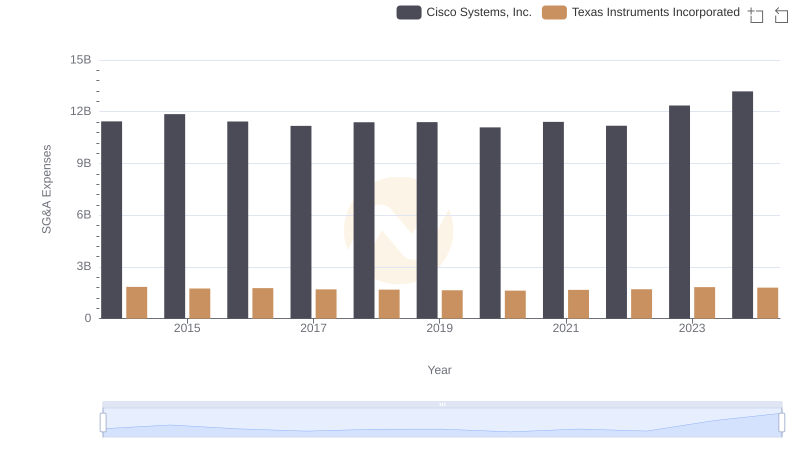
Cisco Systems, Inc. or Texas Instruments Incorporated: Who Manages SG&A Costs Better?
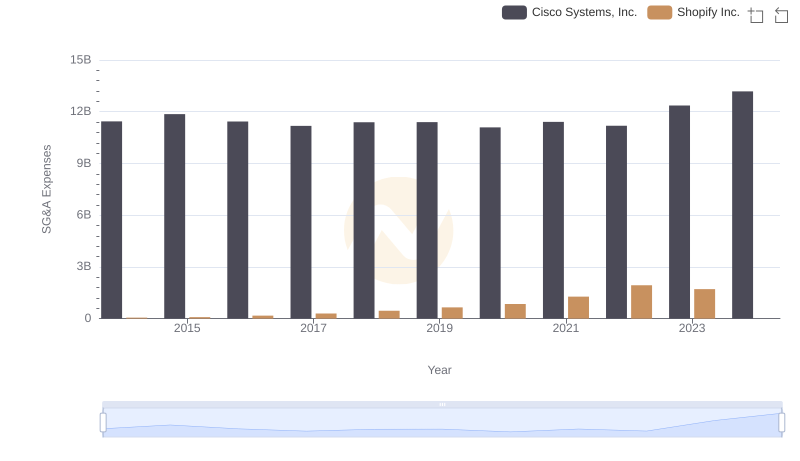
Cisco Systems, Inc. and Shopify Inc.: SG&A Spending Patterns Compared