| __timestamp | Dover Corporation | Parker-Hannifin Corporation |
|---|---|---|
| Wednesday, January 1, 2014 | 1758765000 | 1633992000 |
| Thursday, January 1, 2015 | 1647382000 | 1544746000 |
| Friday, January 1, 2016 | 1757523000 | 1359360000 |
| Sunday, January 1, 2017 | 1975932000 | 1453935000 |
| Monday, January 1, 2018 | 1716444000 | 1657152000 |
| Tuesday, January 1, 2019 | 1599098000 | 1543939000 |
| Wednesday, January 1, 2020 | 1541032000 | 1656553000 |
| Friday, January 1, 2021 | 1688278000 | 1527302000 |
| Saturday, January 1, 2022 | 1684226000 | 1627116000 |
| Sunday, January 1, 2023 | 1718290000 | 3354103000 |
| Monday, January 1, 2024 | 1752266000 | 3315177000 |
Unleashing the power of data
In the competitive landscape of industrial manufacturing, Parker-Hannifin Corporation and Dover Corporation have showcased distinct trends in their Selling, General, and Administrative (SG&A) expenses over the past decade. From 2014 to 2023, Parker-Hannifin's SG&A expenses surged by over 100%, peaking dramatically in 2023. This spike, reaching approximately $3.35 billion, marks a significant strategic shift or investment. In contrast, Dover Corporation maintained a more stable SG&A expenditure, with fluctuations around the $1.7 billion mark, reflecting a consistent operational strategy. Notably, 2020 saw Dover's lowest SG&A spending, possibly due to global economic challenges. The data for 2024 is incomplete, leaving room for speculation on future trends. These insights offer a window into the financial strategies of these industrial giants, highlighting Parker-Hannifin's aggressive growth approach compared to Dover's steady course.

Who Generates More Revenue? Parker-Hannifin Corporation or Dover Corporation
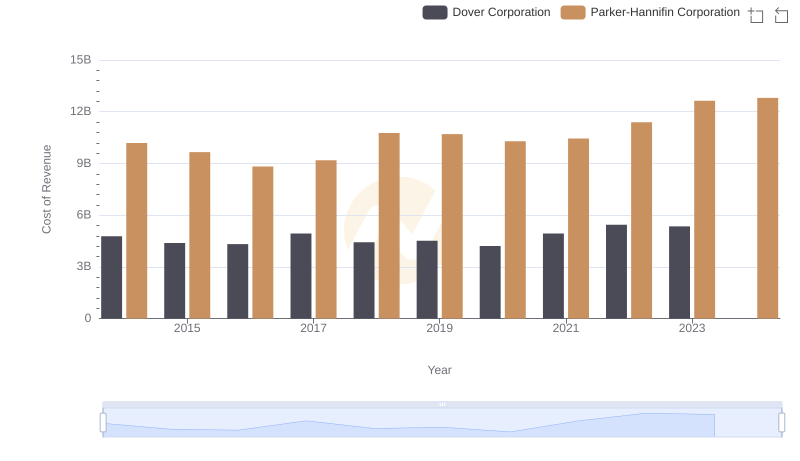
Cost Insights: Breaking Down Parker-Hannifin Corporation and Dover Corporation's Expenses
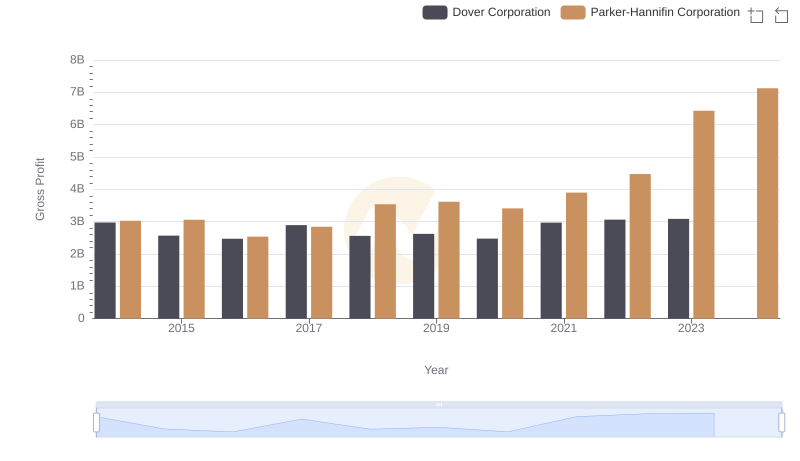
Gross Profit Comparison: Parker-Hannifin Corporation and Dover Corporation Trends
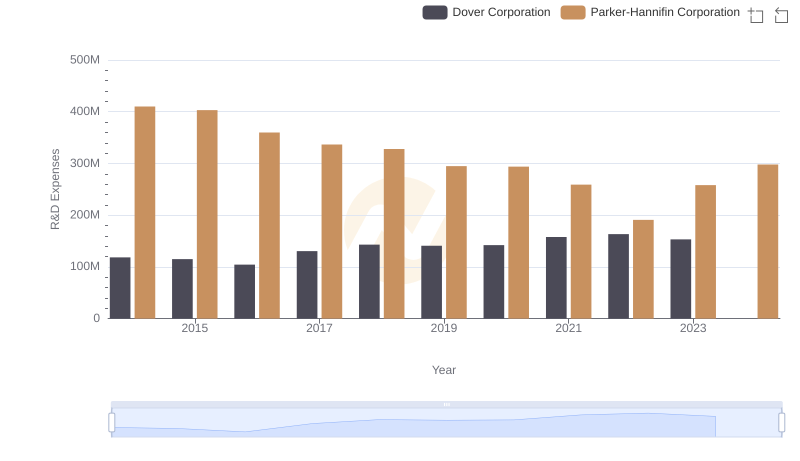
Research and Development: Comparing Key Metrics for Parker-Hannifin Corporation and Dover Corporation
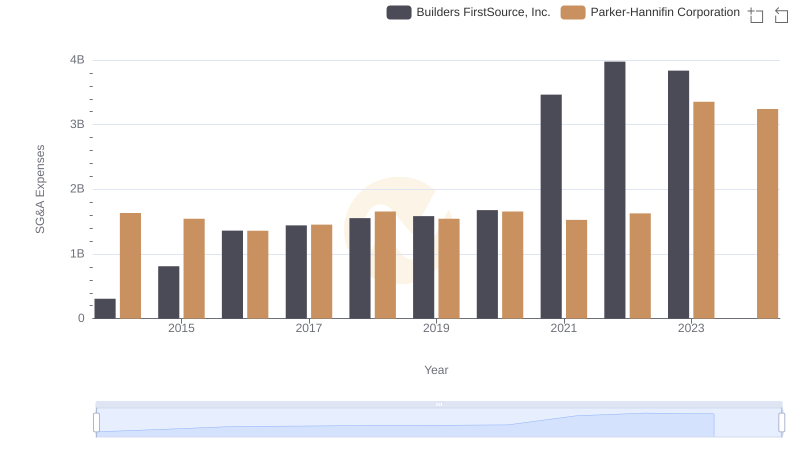
Comparing SG&A Expenses: Parker-Hannifin Corporation vs Builders FirstSource, Inc. Trends and Insights
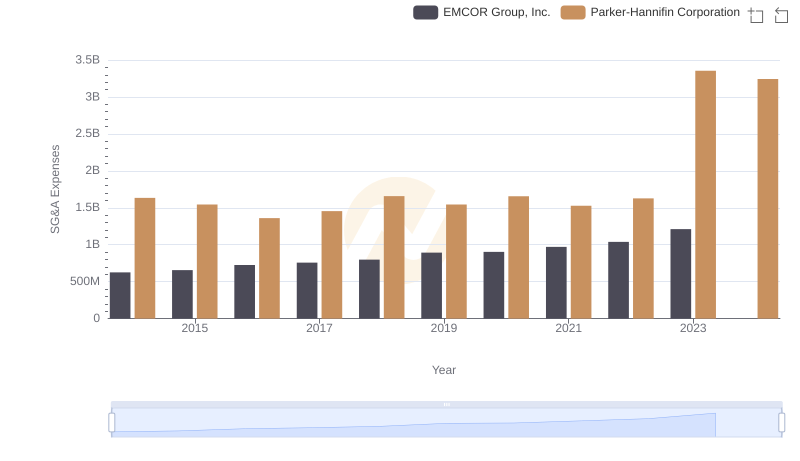
Who Optimizes SG&A Costs Better? Parker-Hannifin Corporation or EMCOR Group, Inc.
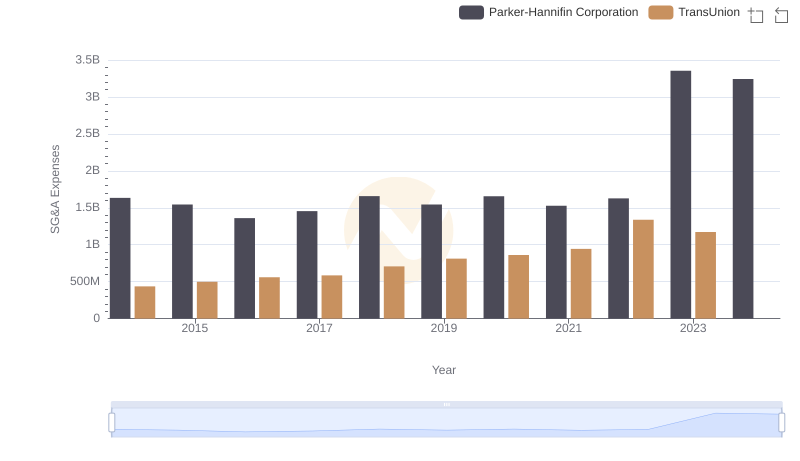
Selling, General, and Administrative Costs: Parker-Hannifin Corporation vs TransUnion
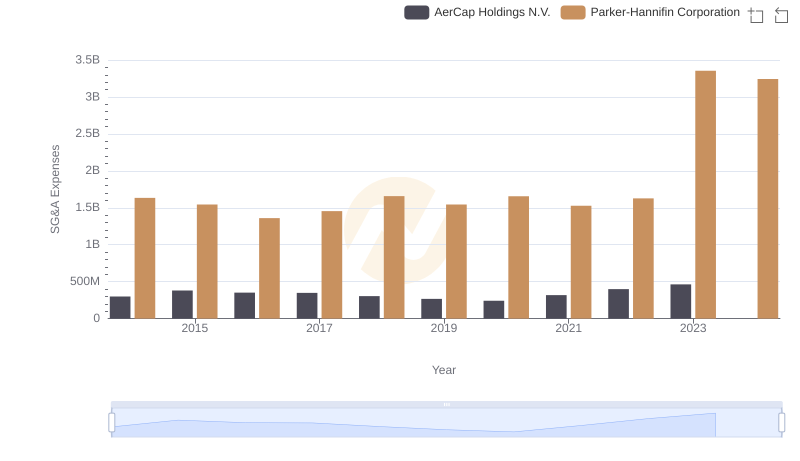
Who Optimizes SG&A Costs Better? Parker-Hannifin Corporation or AerCap Holdings N.V.