| __timestamp | Equifax Inc. | Old Dominion Freight Line, Inc. |
|---|---|---|
| Wednesday, January 1, 2014 | 844700000 | 2100409000 |
| Thursday, January 1, 2015 | 887400000 | 2214943000 |
| Friday, January 1, 2016 | 1113400000 | 2246890000 |
| Sunday, January 1, 2017 | 1210700000 | 2482732000 |
| Monday, January 1, 2018 | 1440400000 | 2899452000 |
| Tuesday, January 1, 2019 | 1521700000 | 2938895000 |
| Wednesday, January 1, 2020 | 1737400000 | 2786531000 |
| Friday, January 1, 2021 | 1980900000 | 3481268000 |
| Saturday, January 1, 2022 | 2177200000 | 4003951000 |
| Sunday, January 1, 2023 | 2335100000 | 3793953000 |
| Monday, January 1, 2024 | 0 |
Data in motion
In the ever-evolving landscape of American business, understanding cost structures is crucial. This analysis delves into the cost of revenue trends for two industry giants: Old Dominion Freight Line, Inc. and Equifax Inc., from 2014 to 2023.
Old Dominion Freight Line, Inc. has seen a remarkable 80% increase in its cost of revenue over the past decade, peaking in 2022. This growth reflects the company's expanding operations and market reach. In contrast, Equifax Inc. experienced a 176% rise, indicating significant investments in data security and technology enhancements post-2017.
While both companies have shown upward trends, Old Dominion's cost of revenue consistently outpaces Equifax's by a factor of nearly 2:1. This disparity highlights the differing operational scales and industry demands. As we move forward, these insights provide a window into strategic financial planning and competitive positioning.
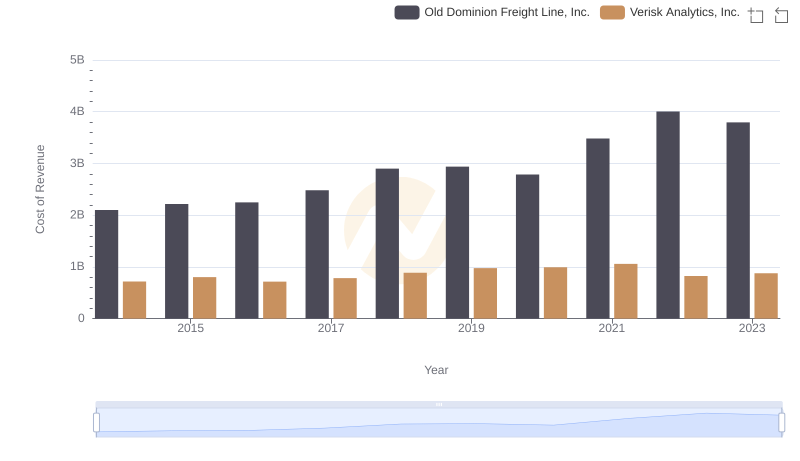
Cost of Revenue: Key Insights for Old Dominion Freight Line, Inc. and Verisk Analytics, Inc.
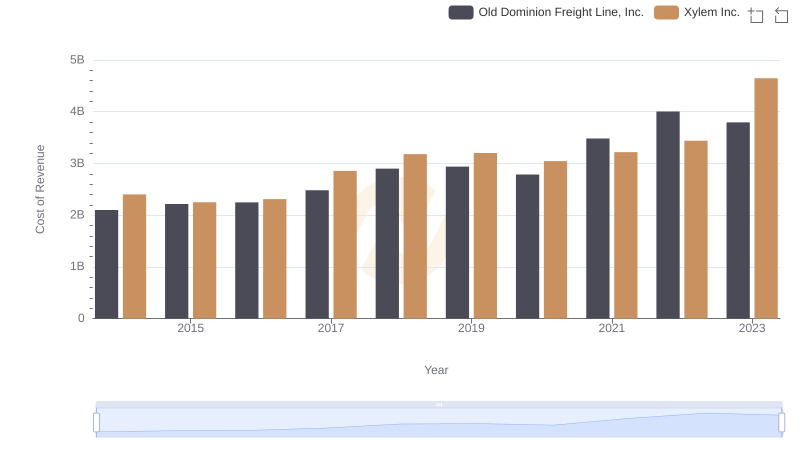
Cost Insights: Breaking Down Old Dominion Freight Line, Inc. and Xylem Inc.'s Expenses
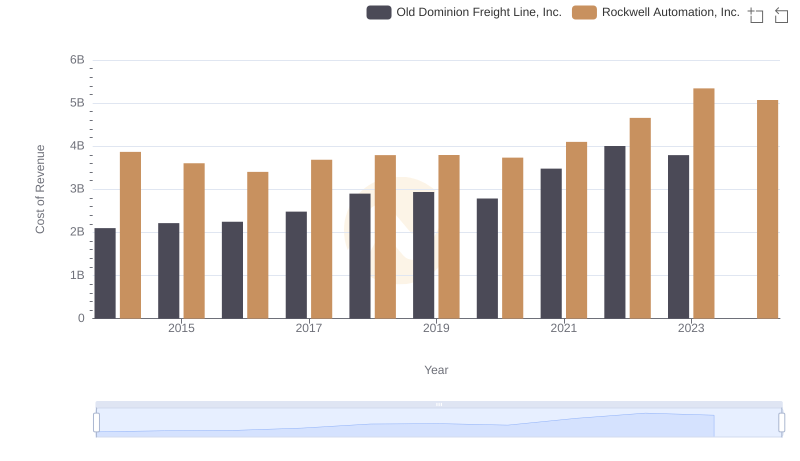
Comparing Cost of Revenue Efficiency: Old Dominion Freight Line, Inc. vs Rockwell Automation, Inc.
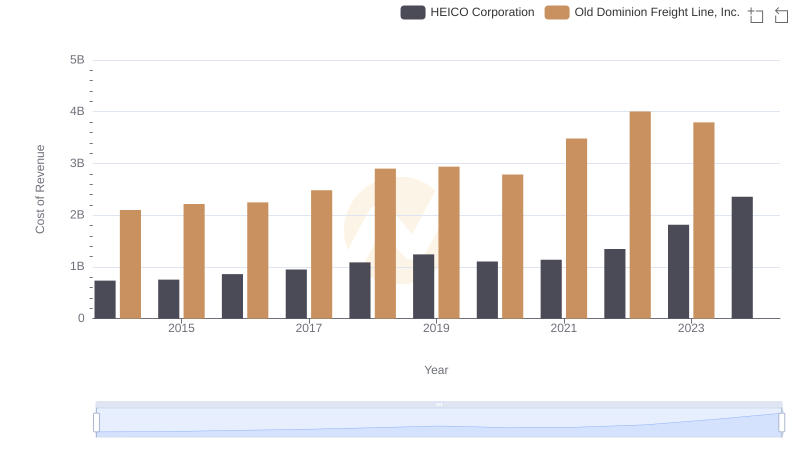
Cost of Revenue Trends: Old Dominion Freight Line, Inc. vs HEICO Corporation
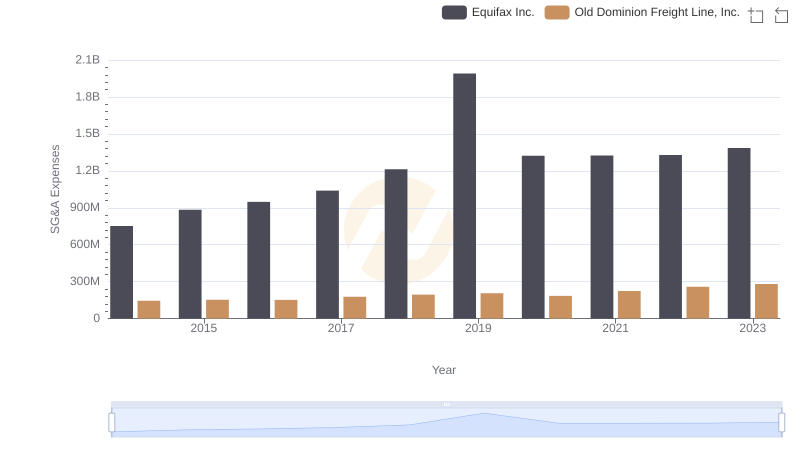
Who Optimizes SG&A Costs Better? Old Dominion Freight Line, Inc. or Equifax Inc.