| __timestamp | Old Dominion Freight Line, Inc. | Xylem Inc. |
|---|---|---|
| Wednesday, January 1, 2014 | 585590000 | 631000000 |
| Thursday, January 1, 2015 | 660570000 | 588000000 |
| Friday, January 1, 2016 | 671786000 | 637000000 |
| Sunday, January 1, 2017 | 783749000 | 814000000 |
| Monday, January 1, 2018 | 1046059000 | 948000000 |
| Tuesday, January 1, 2019 | 1078007000 | 947000000 |
| Wednesday, January 1, 2020 | 1168149000 | 736000000 |
| Friday, January 1, 2021 | 1651501000 | 853000000 |
| Saturday, January 1, 2022 | 2118962000 | 755000000 |
| Sunday, January 1, 2023 | 1972689000 | 1150000000 |
Data in motion
In the ever-evolving landscape of American industry, Old Dominion Freight Line, Inc. and Xylem Inc. stand as titans in their respective fields. Over the past decade, these companies have showcased remarkable EBITDA growth, reflecting their strategic prowess and market adaptability.
From 2014 to 2023, Old Dominion Freight Line, Inc. has seen its EBITDA soar by over 230%, peaking in 2022. This growth underscores the company's robust logistics network and its ability to capitalize on the burgeoning demand for freight services.
Meanwhile, Xylem Inc., a leader in water technology, experienced a more modest EBITDA increase of approximately 82% over the same period. Despite fluctuations, 2023 marked a significant rebound, highlighting Xylem's resilience and innovation in addressing global water challenges.
This comparative analysis not only highlights the financial trajectories of these industry leaders but also offers insights into their strategic directions.
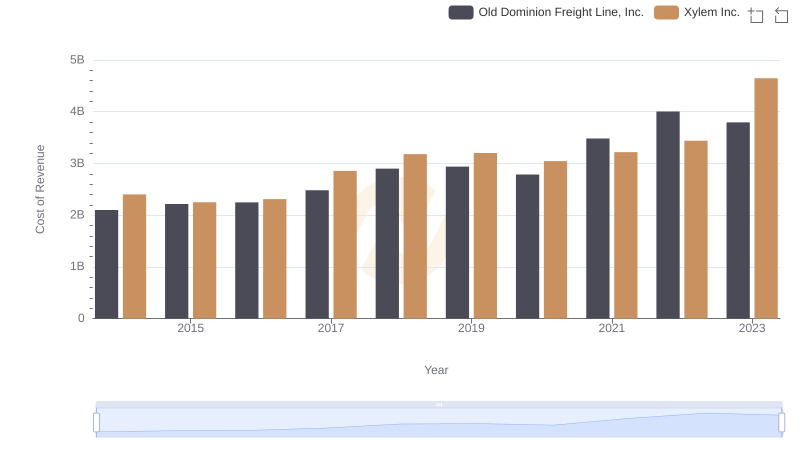
Cost Insights: Breaking Down Old Dominion Freight Line, Inc. and Xylem Inc.'s Expenses
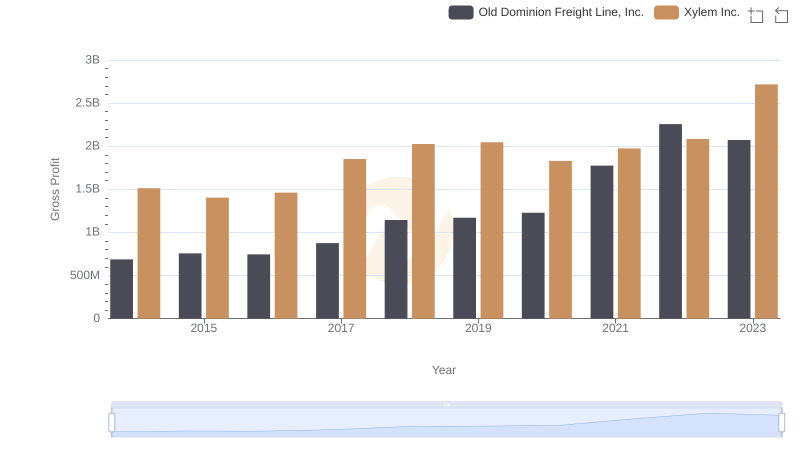
Who Generates Higher Gross Profit? Old Dominion Freight Line, Inc. or Xylem Inc.
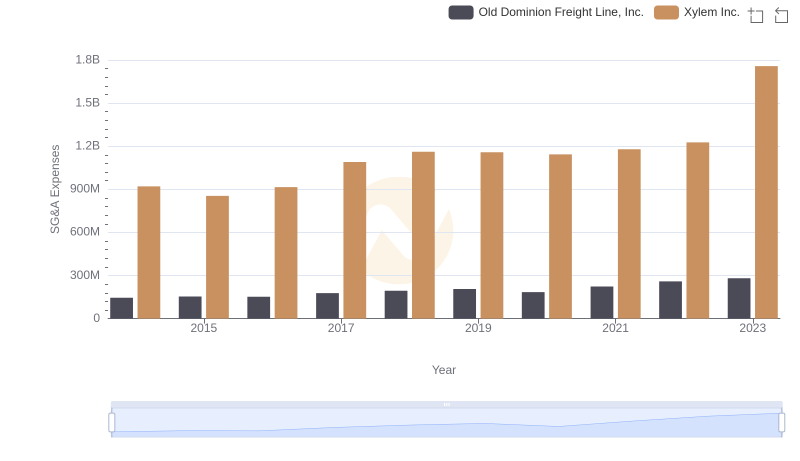
Operational Costs Compared: SG&A Analysis of Old Dominion Freight Line, Inc. and Xylem Inc.
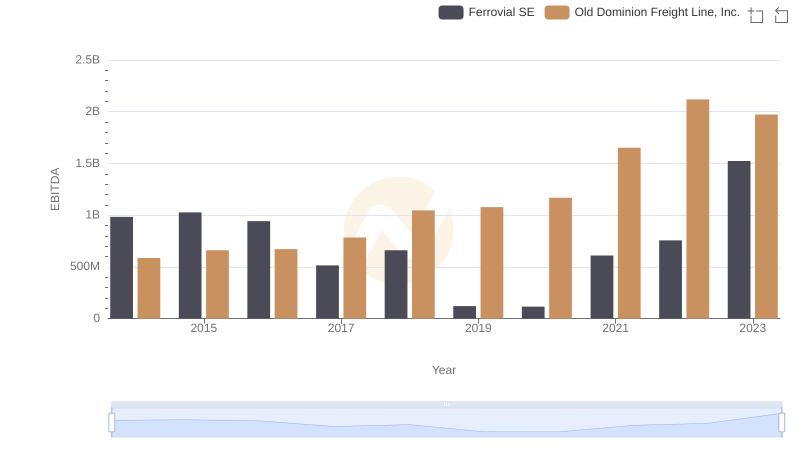
EBITDA Analysis: Evaluating Old Dominion Freight Line, Inc. Against Ferrovial SE
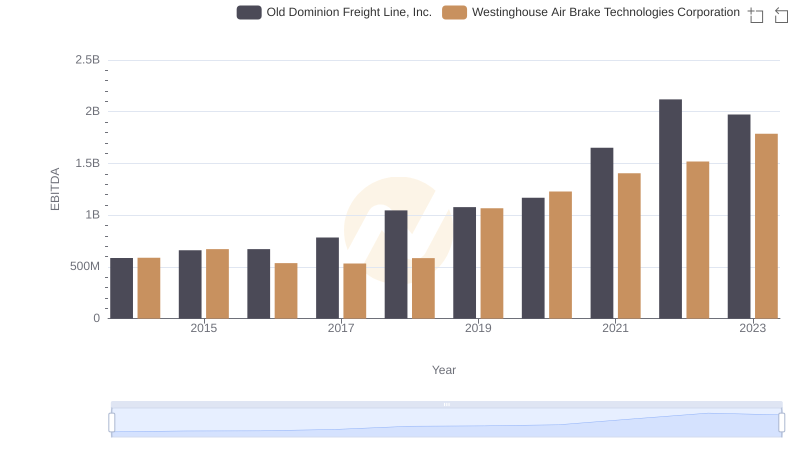
Old Dominion Freight Line, Inc. vs Westinghouse Air Brake Technologies Corporation: In-Depth EBITDA Performance Comparison
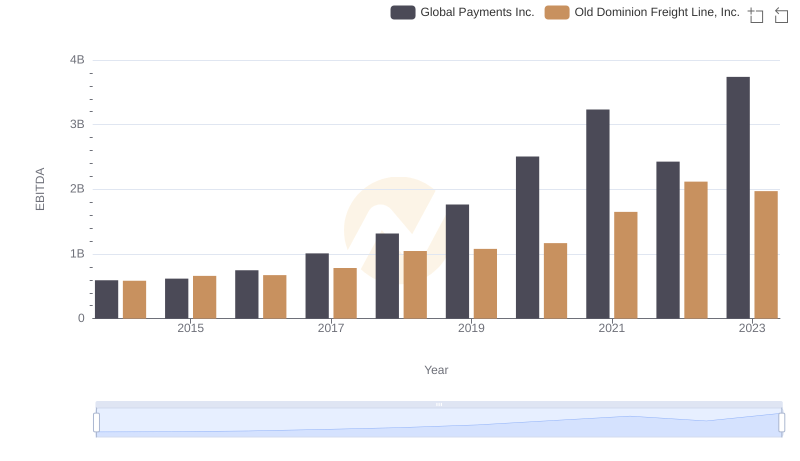
EBITDA Analysis: Evaluating Old Dominion Freight Line, Inc. Against Global Payments Inc.
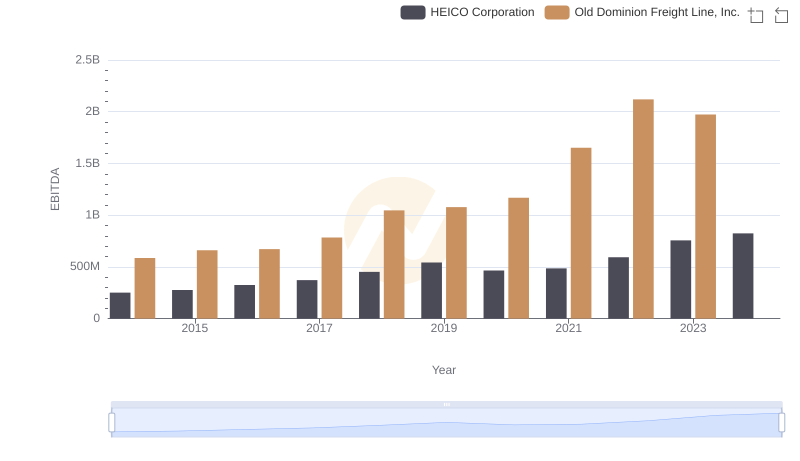
EBITDA Performance Review: Old Dominion Freight Line, Inc. vs HEICO Corporation
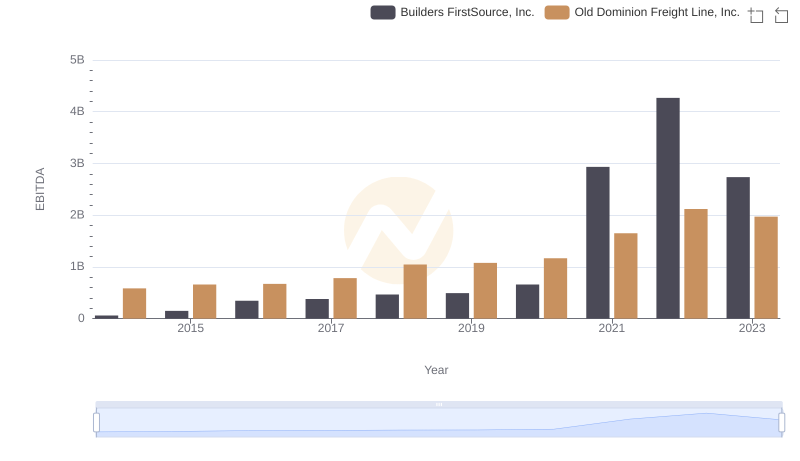
Comprehensive EBITDA Comparison: Old Dominion Freight Line, Inc. vs Builders FirstSource, Inc.