| __timestamp | Cisco Systems, Inc. | FLEETCOR Technologies, Inc. |
|---|---|---|
| Wednesday, January 1, 2014 | 27769000000 | 1026053000 |
| Thursday, January 1, 2015 | 29681000000 | 1371792000 |
| Friday, January 1, 2016 | 30960000000 | 1476132000 |
| Sunday, January 1, 2017 | 30224000000 | 1819925000 |
| Monday, January 1, 2018 | 30606000000 | 1945797000 |
| Tuesday, January 1, 2019 | 32666000000 | 2118179000 |
| Wednesday, January 1, 2020 | 31683000000 | 1792492000 |
| Friday, January 1, 2021 | 31894000000 | 2273917000 |
| Saturday, January 1, 2022 | 32248000000 | 2662422000 |
| Sunday, January 1, 2023 | 35753000000 | 2727580001 |
| Monday, January 1, 2024 | 34828000000 | 3974589000 |
Igniting the spark of knowledge
In the ever-evolving landscape of technology and financial services, Cisco Systems, Inc. and FLEETCOR Technologies, Inc. have shown distinct trajectories in their gross profit over the past decade. From 2014 to 2023, Cisco's gross profit has consistently outpaced FLEETCOR's, with a notable increase of approximately 29% from 2014 to 2023. In contrast, FLEETCOR's gross profit grew by about 166% during the same period, reflecting its dynamic growth in the financial services sector.
These trends underscore the contrasting growth strategies and market dynamics of these industry leaders.
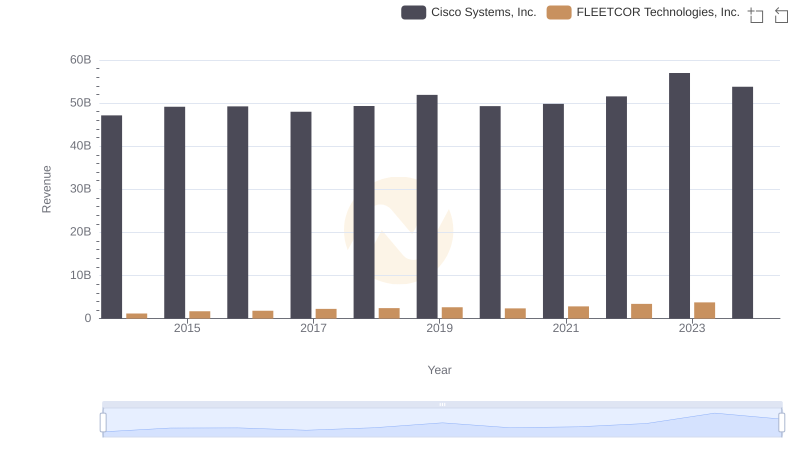
Revenue Insights: Cisco Systems, Inc. and FLEETCOR Technologies, Inc. Performance Compared
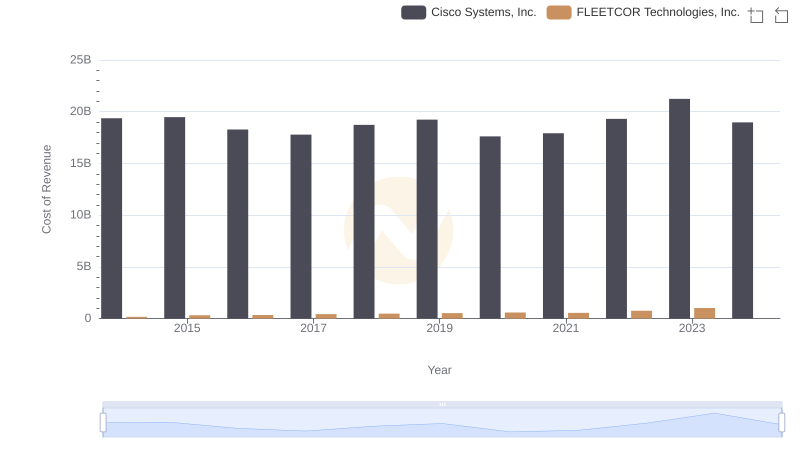
Cost Insights: Breaking Down Cisco Systems, Inc. and FLEETCOR Technologies, Inc.'s Expenses
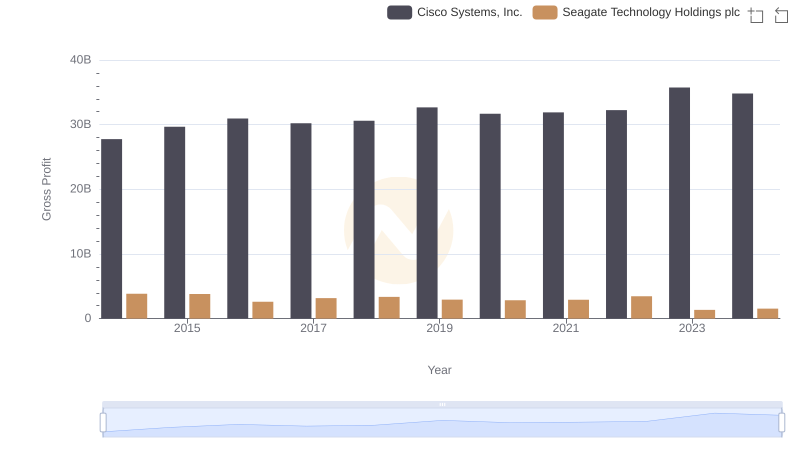
Who Generates Higher Gross Profit? Cisco Systems, Inc. or Seagate Technology Holdings plc
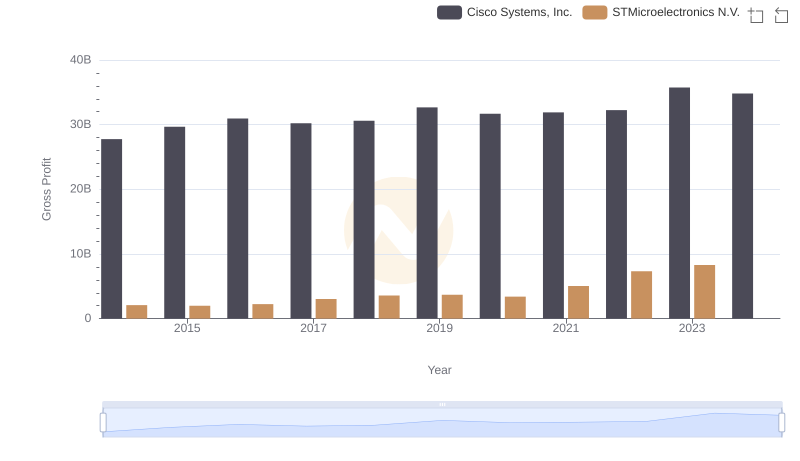
Cisco Systems, Inc. and STMicroelectronics N.V.: A Detailed Gross Profit Analysis
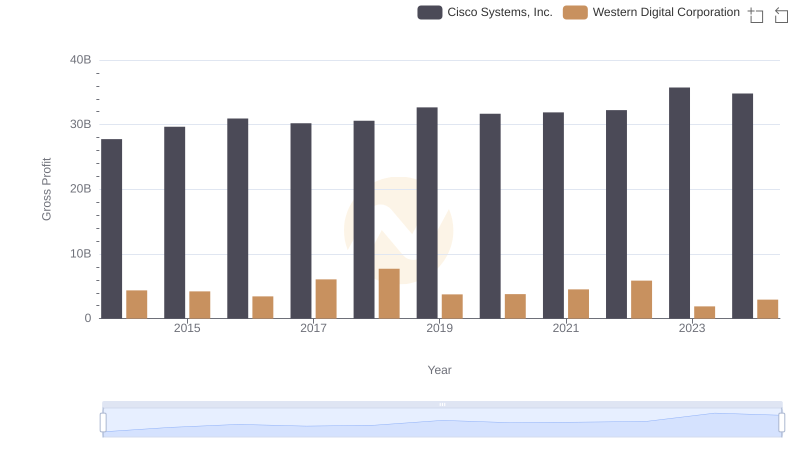
Cisco Systems, Inc. and Western Digital Corporation: A Detailed Gross Profit Analysis
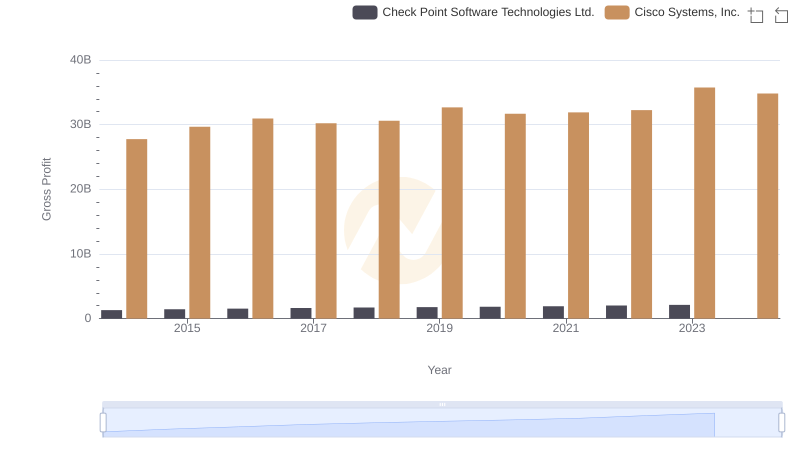
Key Insights on Gross Profit: Cisco Systems, Inc. vs Check Point Software Technologies Ltd.
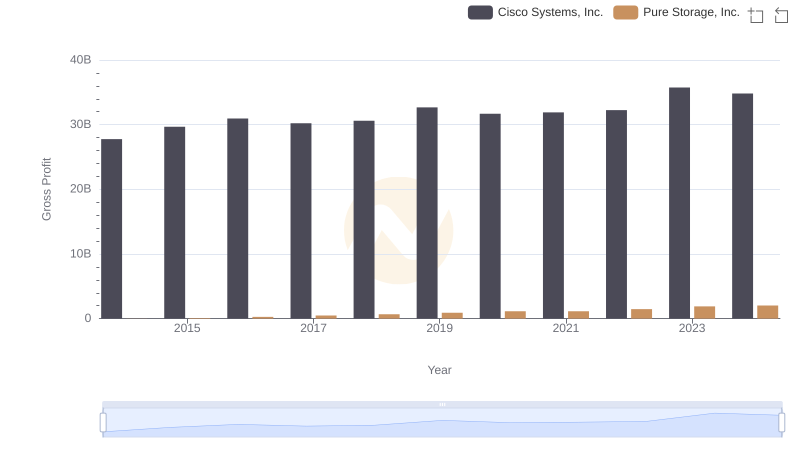
Gross Profit Comparison: Cisco Systems, Inc. and Pure Storage, Inc. Trends
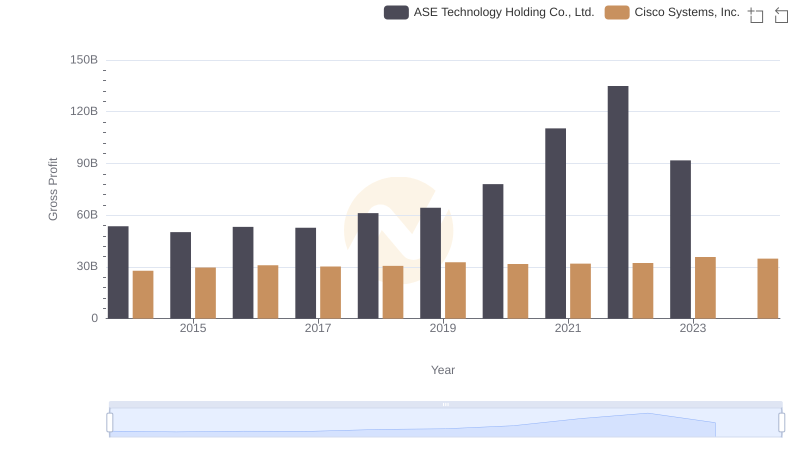
Cisco Systems, Inc. vs ASE Technology Holding Co., Ltd.: A Gross Profit Performance Breakdown
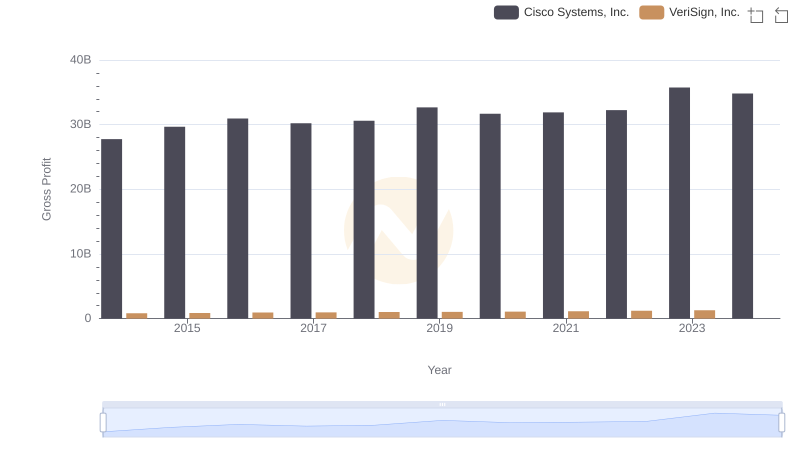
Cisco Systems, Inc. vs VeriSign, Inc.: A Gross Profit Performance Breakdown
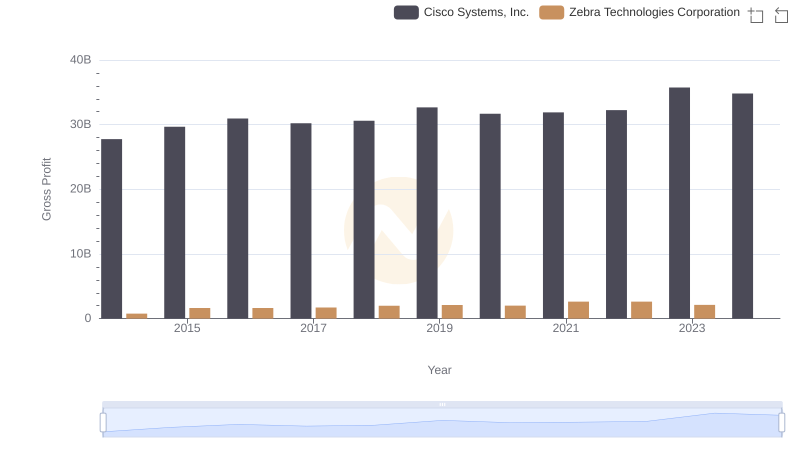
Key Insights on Gross Profit: Cisco Systems, Inc. vs Zebra Technologies Corporation
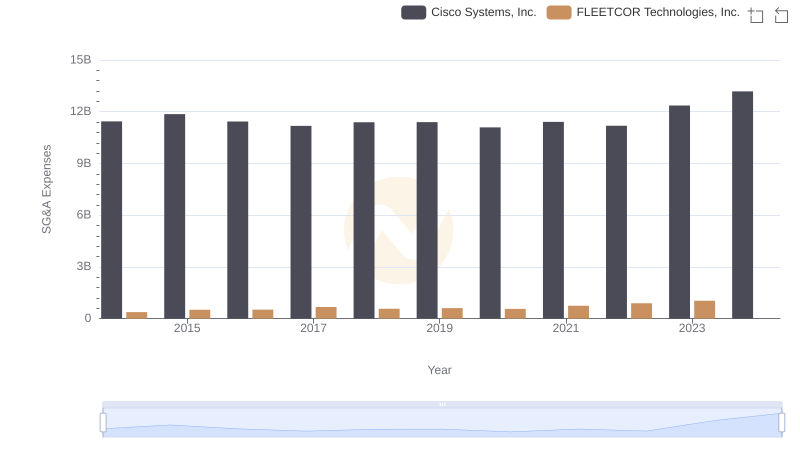
Cisco Systems, Inc. vs FLEETCOR Technologies, Inc.: SG&A Expense Trends
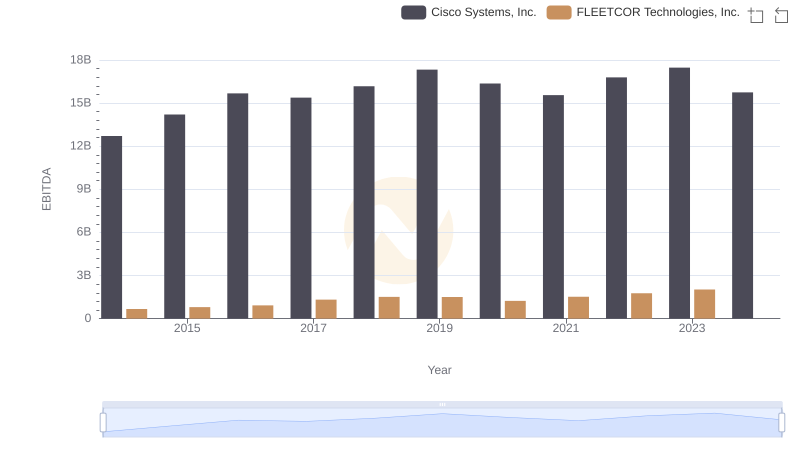
EBITDA Metrics Evaluated: Cisco Systems, Inc. vs FLEETCOR Technologies, Inc.