| __timestamp | Cintas Corporation | Xylem Inc. |
|---|---|---|
| Wednesday, January 1, 2014 | 4551812000 | 3916000000 |
| Thursday, January 1, 2015 | 4476886000 | 3653000000 |
| Friday, January 1, 2016 | 4905458000 | 3771000000 |
| Sunday, January 1, 2017 | 5323381000 | 4707000000 |
| Monday, January 1, 2018 | 6476632000 | 5207000000 |
| Tuesday, January 1, 2019 | 6892303000 | 5249000000 |
| Wednesday, January 1, 2020 | 7085120000 | 4876000000 |
| Friday, January 1, 2021 | 7116340000 | 5195000000 |
| Saturday, January 1, 2022 | 7854459000 | 5522000000 |
| Sunday, January 1, 2023 | 8815769000 | 7364000000 |
| Monday, January 1, 2024 | 9596615000 |
Infusing magic into the data realm
In the ever-evolving landscape of industrial services and water technology, Cintas Corporation and Xylem Inc. have showcased intriguing revenue trajectories over the past decade. Since 2014, Cintas has demonstrated a robust growth pattern, with its revenue surging by approximately 111% by 2023. This growth reflects Cintas's strategic expansion and market adaptability. In contrast, Xylem Inc. has experienced a more modest revenue increase of around 88% over the same period, highlighting its steady yet impactful presence in the water technology sector.
The data for 2024 is incomplete, leaving room for speculation on future trends.
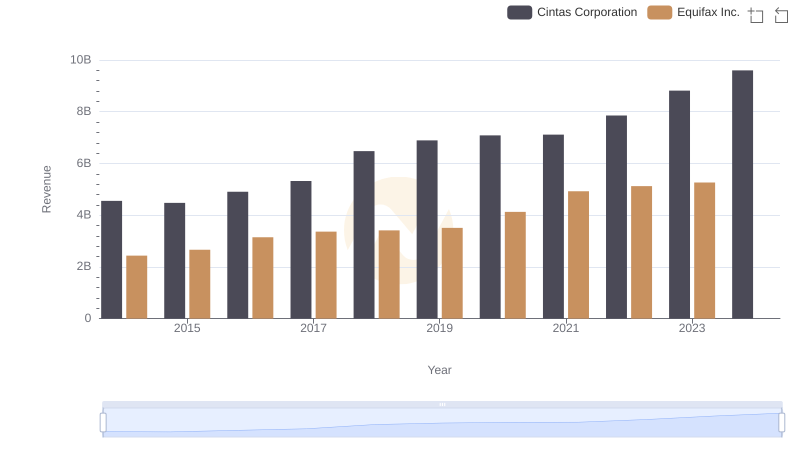
Cintas Corporation vs Equifax Inc.: Examining Key Revenue Metrics
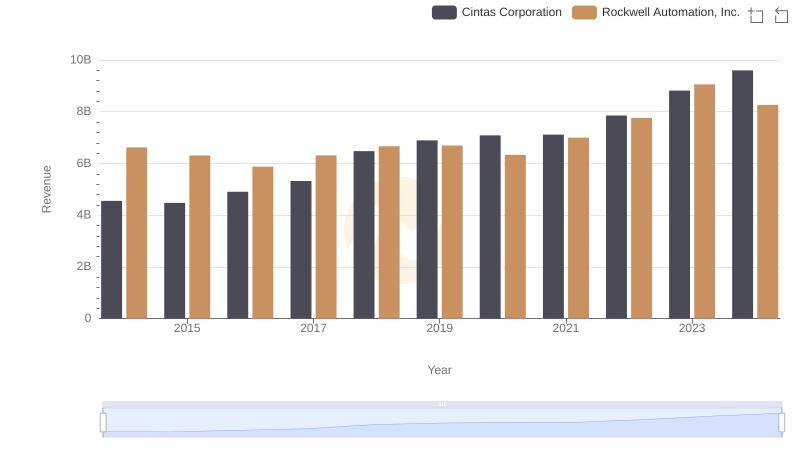
Who Generates More Revenue? Cintas Corporation or Rockwell Automation, Inc.
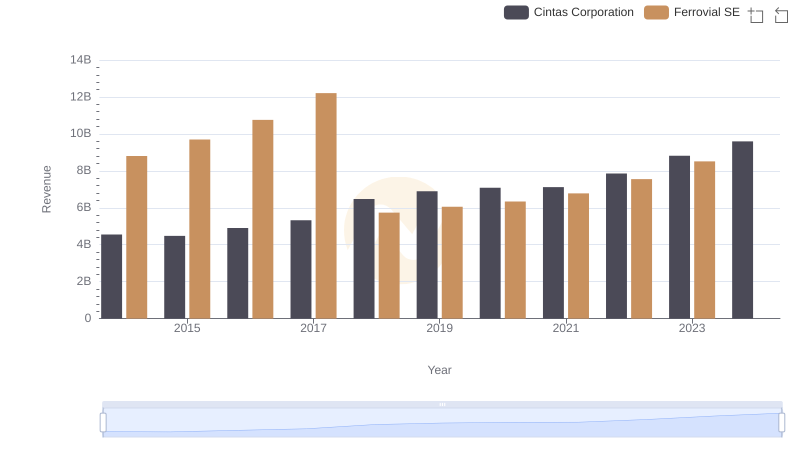
Cintas Corporation or Ferrovial SE: Who Leads in Yearly Revenue?
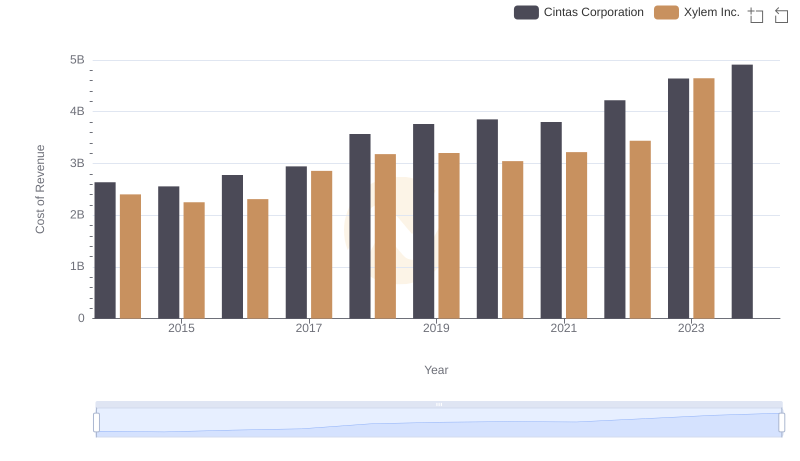
Cost Insights: Breaking Down Cintas Corporation and Xylem Inc.'s Expenses
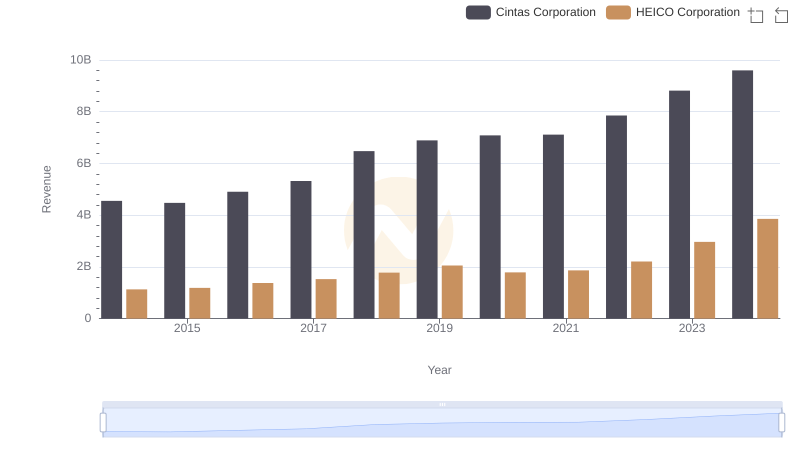
Breaking Down Revenue Trends: Cintas Corporation vs HEICO Corporation
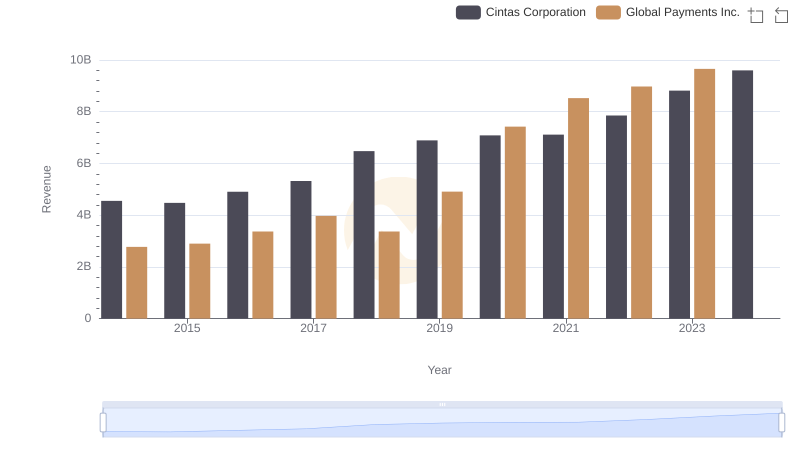
Comparing Revenue Performance: Cintas Corporation or Global Payments Inc.?
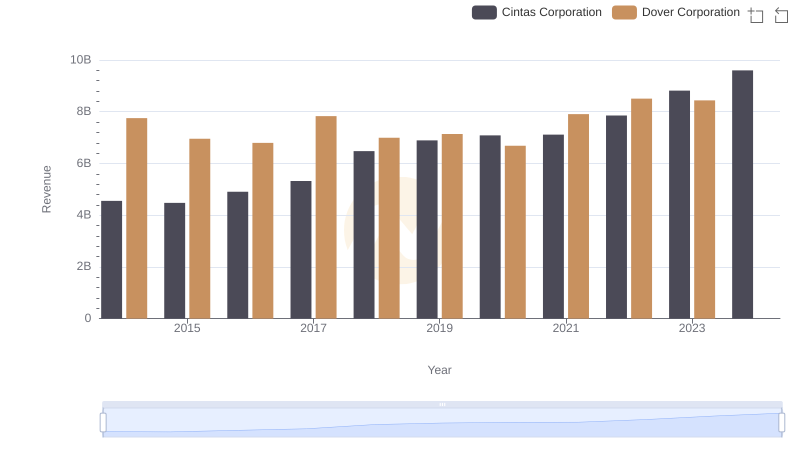
Revenue Insights: Cintas Corporation and Dover Corporation Performance Compared
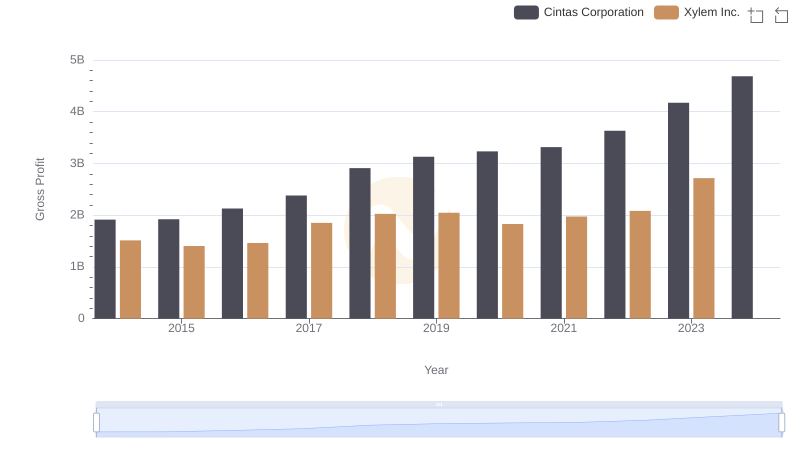
Gross Profit Analysis: Comparing Cintas Corporation and Xylem Inc.
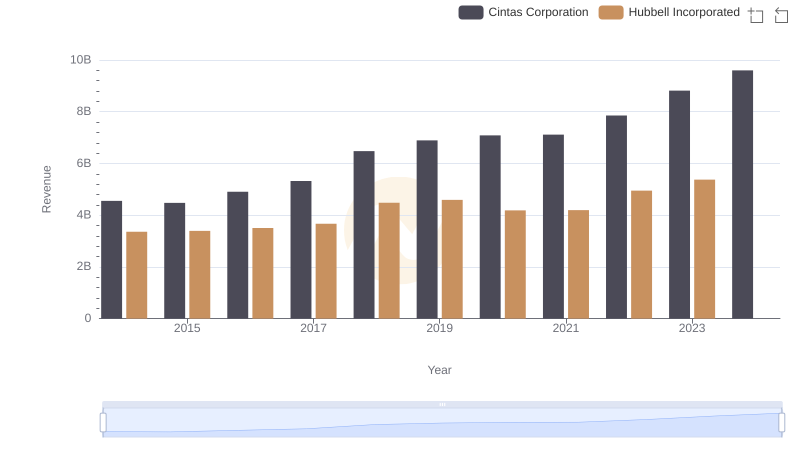
Comparing Revenue Performance: Cintas Corporation or Hubbell Incorporated?
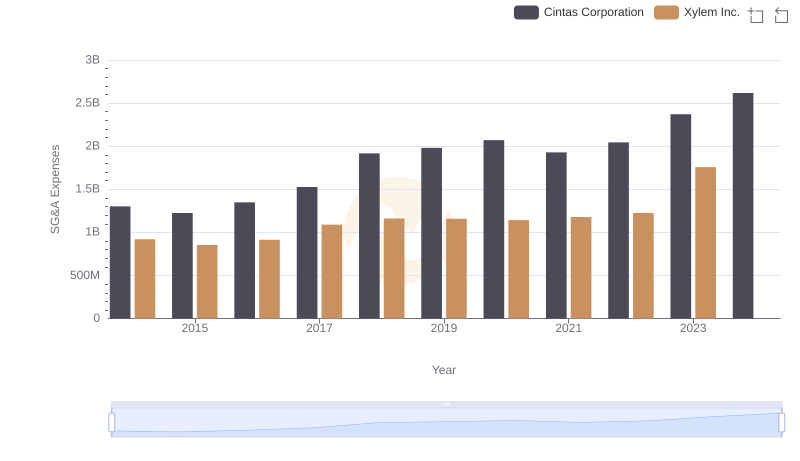
Cintas Corporation or Xylem Inc.: Who Manages SG&A Costs Better?
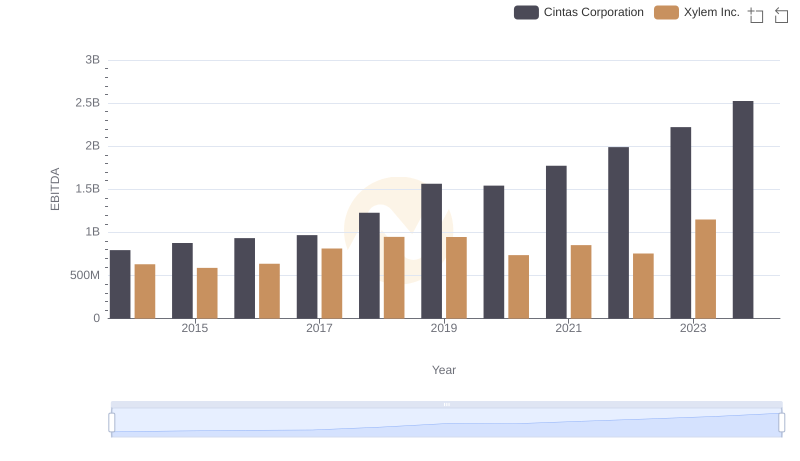
Professional EBITDA Benchmarking: Cintas Corporation vs Xylem Inc.