| __timestamp | General Dynamics Corporation | Waste Management, Inc. |
|---|---|---|
| Wednesday, January 1, 2014 | 5873000000 | 4994000000 |
| Thursday, January 1, 2015 | 6130000000 | 4730000000 |
| Friday, January 1, 2016 | 6249000000 | 5123000000 |
| Sunday, January 1, 2017 | 6187000000 | 5464000000 |
| Monday, January 1, 2018 | 6715000000 | 5665000000 |
| Tuesday, January 1, 2019 | 7059000000 | 5959000000 |
| Wednesday, January 1, 2020 | 6325000000 | 5877000000 |
| Friday, January 1, 2021 | 6408000000 | 6820000000 |
| Saturday, January 1, 2022 | 6622000000 | 7404000000 |
| Sunday, January 1, 2023 | 6672000000 | 7820000000 |
| Monday, January 1, 2024 | 7364000000 | 8680000000 |
Data in motion
In the ever-evolving landscape of American industry, Waste Management, Inc. and General Dynamics Corporation stand as titans in their respective fields. Over the past decade, from 2014 to 2023, these companies have showcased intriguing trends in their gross profits. Waste Management, Inc., a leader in environmental services, has seen a steady rise in its gross profit, culminating in a remarkable 57% increase from 2014 to 2023. In contrast, General Dynamics Corporation, a stalwart in aerospace and defense, experienced fluctuations, with a notable peak in 2024. However, data for 2024 is incomplete, leaving room for speculation. This comparison not only highlights the resilience of Waste Management, Inc. in a competitive market but also underscores the volatility faced by defense contractors like General Dynamics. As we look to the future, these trends offer valuable insights into the strategic maneuvers of these industry leaders.
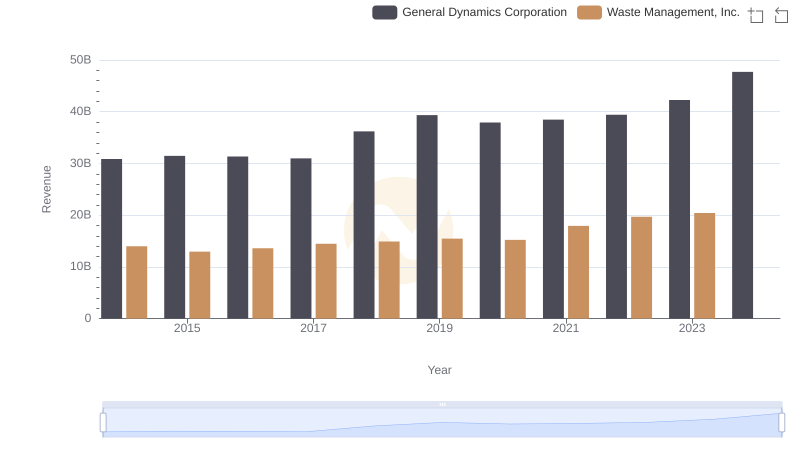
Revenue Insights: Waste Management, Inc. and General Dynamics Corporation Performance Compared
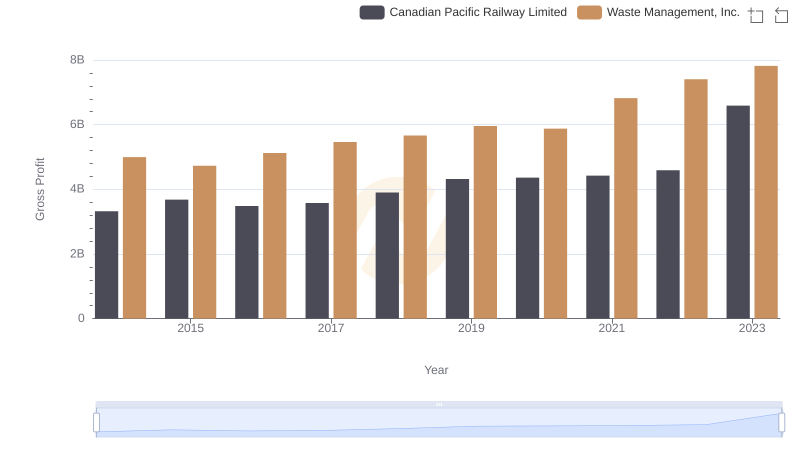
Gross Profit Comparison: Waste Management, Inc. and Canadian Pacific Railway Limited Trends
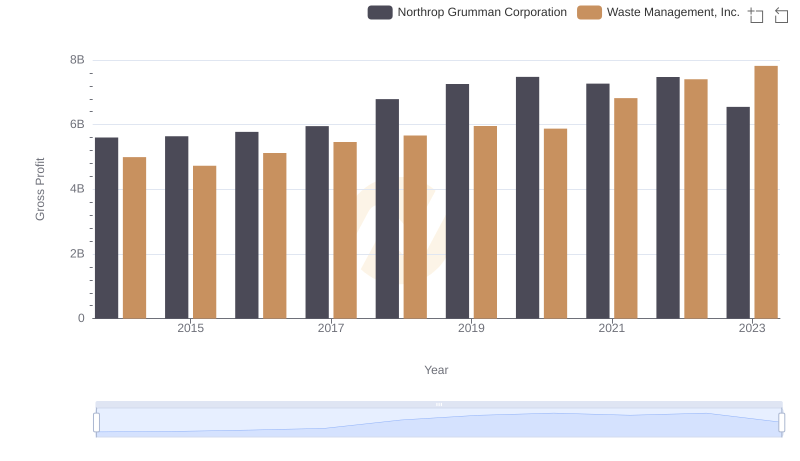
Gross Profit Analysis: Comparing Waste Management, Inc. and Northrop Grumman Corporation
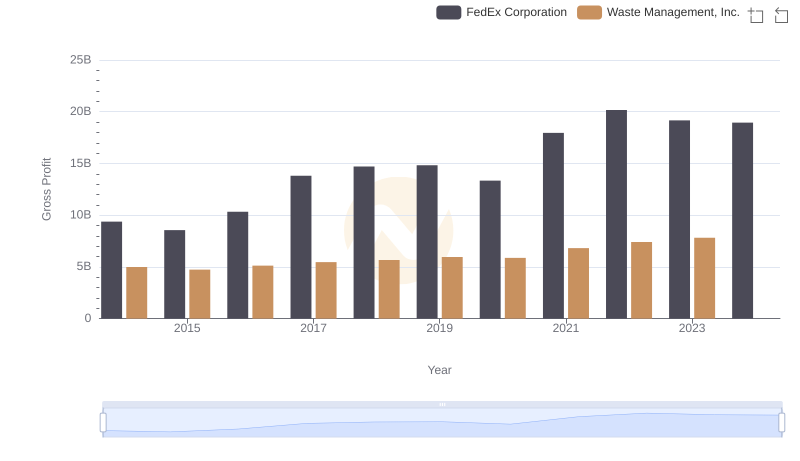
Gross Profit Analysis: Comparing Waste Management, Inc. and FedEx Corporation
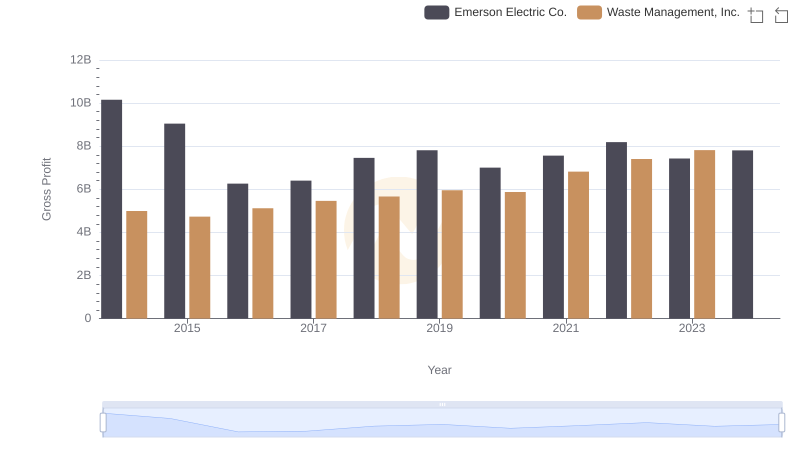
Who Generates Higher Gross Profit? Waste Management, Inc. or Emerson Electric Co.
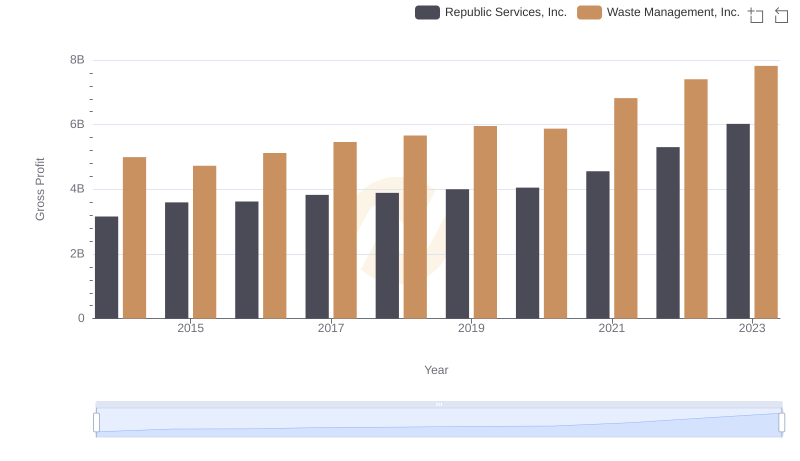
Waste Management, Inc. vs Republic Services, Inc.: A Gross Profit Performance Breakdown
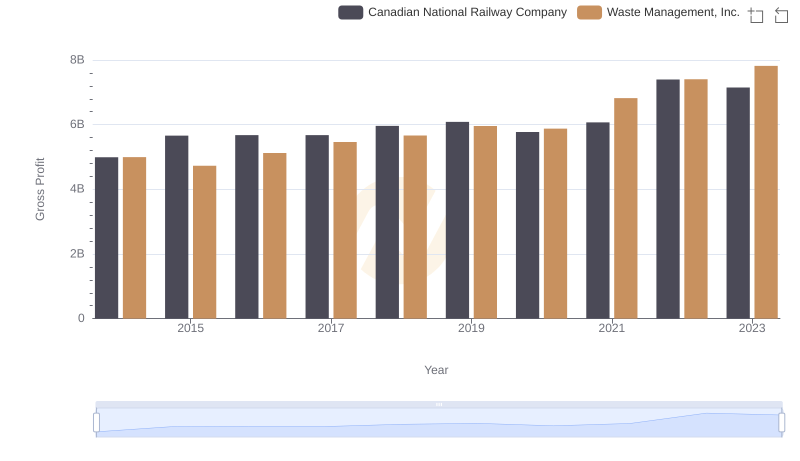
Who Generates Higher Gross Profit? Waste Management, Inc. or Canadian National Railway Company
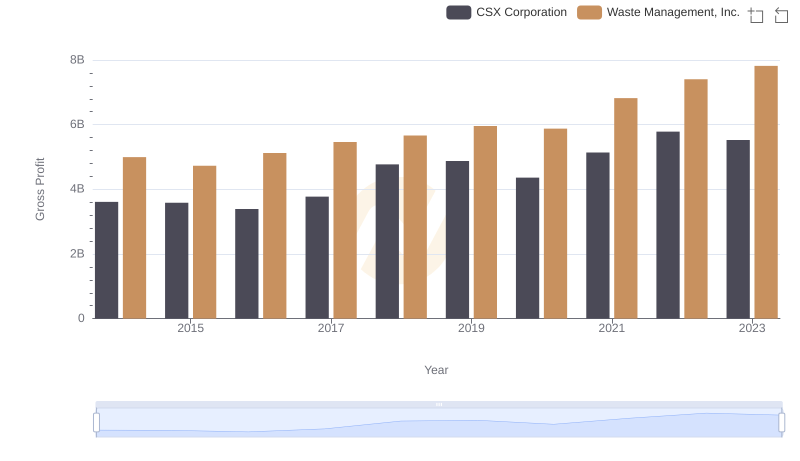
Waste Management, Inc. vs CSX Corporation: A Gross Profit Performance Breakdown
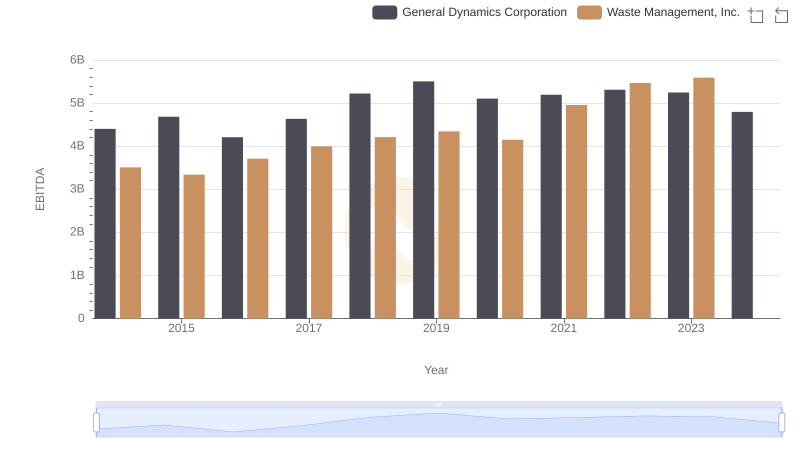
Comprehensive EBITDA Comparison: Waste Management, Inc. vs General Dynamics Corporation