| __timestamp | Pentair plc | Waste Connections, Inc. |
|---|---|---|
| Wednesday, January 1, 2014 | 4563000000 | 1138388000 |
| Thursday, January 1, 2015 | 4263200000 | 1177409000 |
| Friday, January 1, 2016 | 3095900000 | 1957712000 |
| Sunday, January 1, 2017 | 3107400000 | 2704775000 |
| Monday, January 1, 2018 | 1917400000 | 2865704000 |
| Tuesday, January 1, 2019 | 1905700000 | 3198757000 |
| Wednesday, January 1, 2020 | 1960200000 | 3276808000 |
| Friday, January 1, 2021 | 2445600000 | 3654074000 |
| Saturday, January 1, 2022 | 2757200000 | 4336012000 |
| Sunday, January 1, 2023 | 2585300000 | 4744513000 |
| Monday, January 1, 2024 | 2484000000 | 5191706000 |
Unleashing insights
In the ever-evolving landscape of industrial giants, Waste Connections, Inc. and Pentair plc have showcased contrasting trajectories in their cost of revenue from 2014 to 2023. Waste Connections, Inc. has seen a remarkable increase of over 316% in its cost of revenue, reflecting its aggressive expansion and operational scaling. In contrast, Pentair plc experienced a 43% decline, indicating strategic shifts or efficiency improvements.
Starting in 2014, Pentair plc's cost of revenue was significantly higher, but by 2023, Waste Connections, Inc. had surpassed it, reaching nearly double Pentair's figures. This shift highlights the dynamic nature of the industry and the varying strategies companies employ to maintain competitiveness. As we delve into these numbers, it becomes evident that understanding cost structures is crucial for investors and stakeholders aiming to gauge a company's financial health and strategic direction.
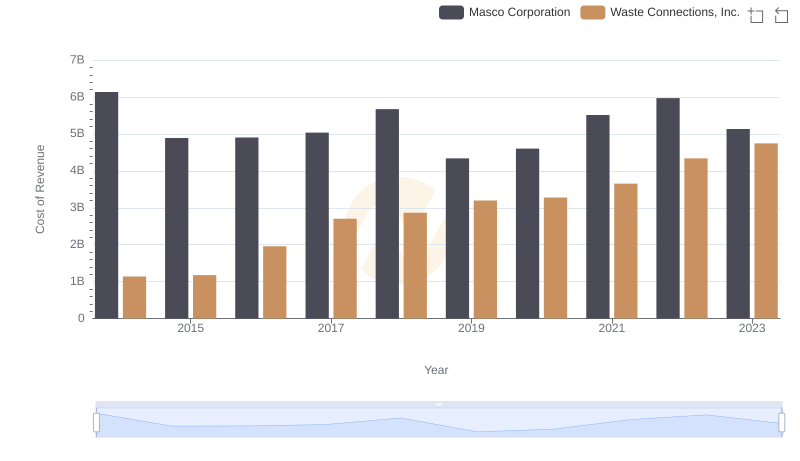
Cost of Revenue Comparison: Waste Connections, Inc. vs Masco Corporation
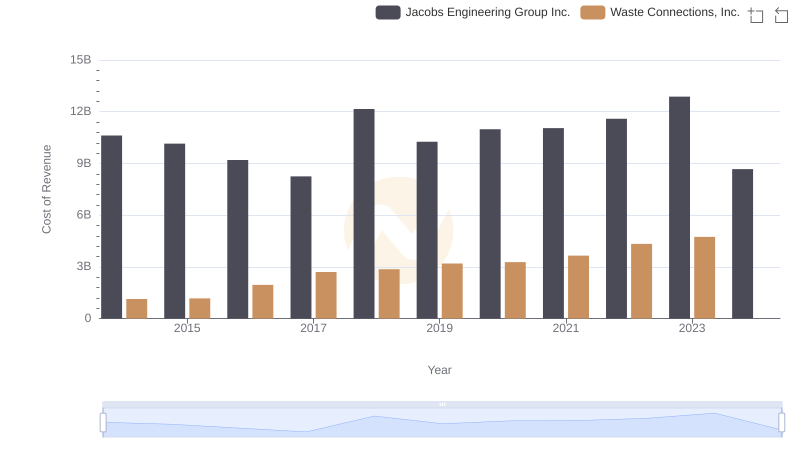
Cost Insights: Breaking Down Waste Connections, Inc. and Jacobs Engineering Group Inc.'s Expenses
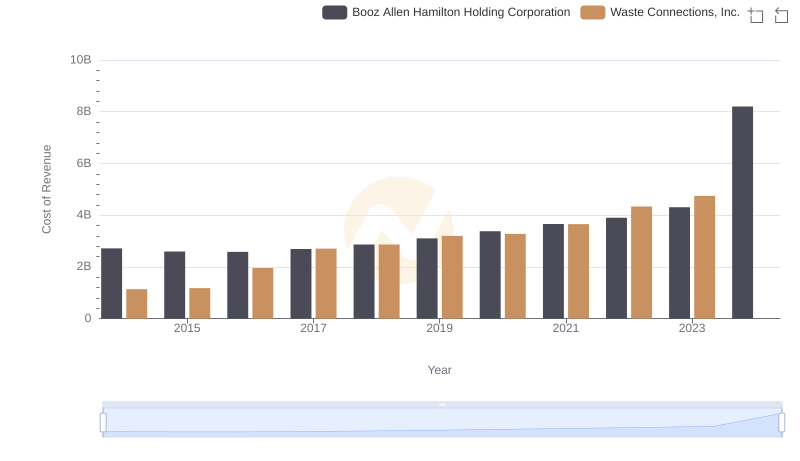
Cost Insights: Breaking Down Waste Connections, Inc. and Booz Allen Hamilton Holding Corporation's Expenses
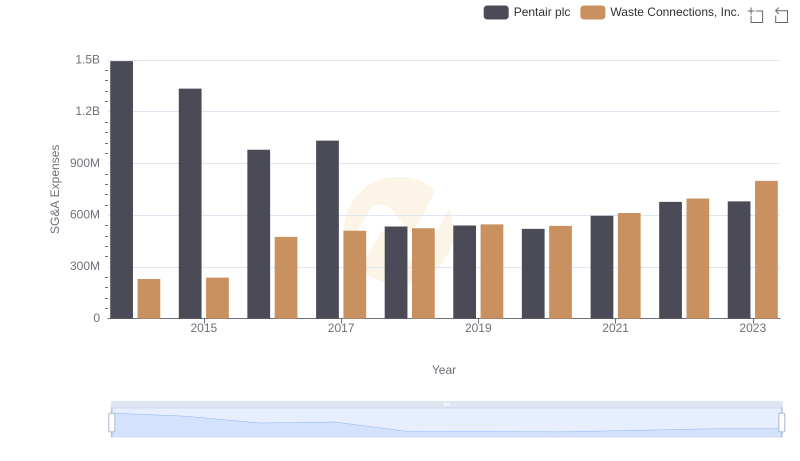
SG&A Efficiency Analysis: Comparing Waste Connections, Inc. and Pentair plc
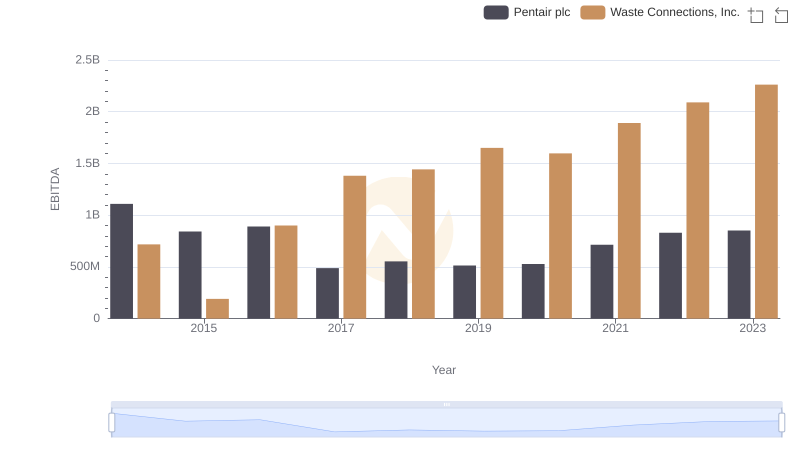
Comprehensive EBITDA Comparison: Waste Connections, Inc. vs Pentair plc