| __timestamp | Builders FirstSource, Inc. | Trane Technologies plc |
|---|---|---|
| Wednesday, January 1, 2014 | 60008000 | 1757000000 |
| Thursday, January 1, 2015 | 148897000 | 1835000000 |
| Friday, January 1, 2016 | 346129000 | 2311000000 |
| Sunday, January 1, 2017 | 378096000 | 1982500000 |
| Monday, January 1, 2018 | 466874000 | 2242400000 |
| Tuesday, January 1, 2019 | 492344000 | 1931200000 |
| Wednesday, January 1, 2020 | 660420000 | 1831900000 |
| Friday, January 1, 2021 | 2934776000 | 2319200000 |
| Saturday, January 1, 2022 | 4267346000 | 2715500000 |
| Sunday, January 1, 2023 | 2734594000 | 3149900000 |
| Monday, January 1, 2024 | 3859600000 |
In pursuit of knowledge
In the ever-evolving landscape of industrial giants, Trane Technologies plc and Builders FirstSource, Inc. have carved out significant niches. Over the past decade, Trane Technologies has consistently demonstrated robust EBITDA growth, peaking in 2023 with a 79% increase from its 2014 figures. Meanwhile, Builders FirstSource has shown remarkable volatility, with a staggering 4,467% rise in EBITDA from 2014 to 2022, before a slight dip in 2023. This dynamic reflects the broader economic shifts and strategic maneuvers within the industry. As we delve into these metrics, it becomes evident that while Trane Technologies offers steady growth, Builders FirstSource presents a more volatile yet potentially rewarding investment. This analysis not only highlights the financial health of these companies but also provides insights into their strategic directions and market adaptability.
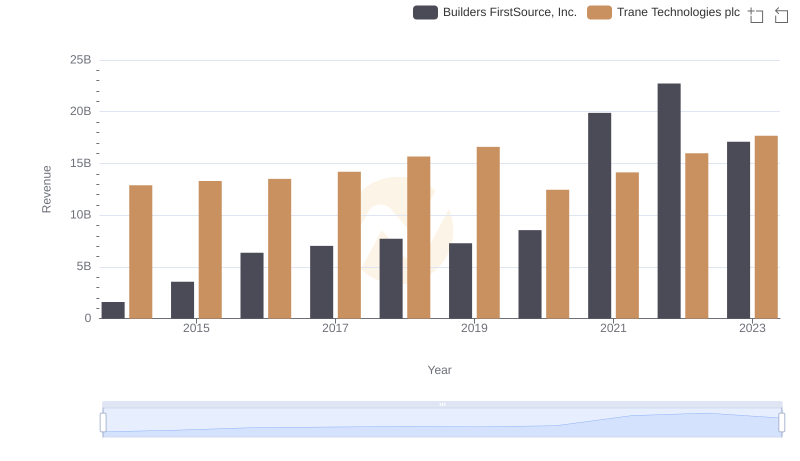
Trane Technologies plc vs Builders FirstSource, Inc.: Examining Key Revenue Metrics
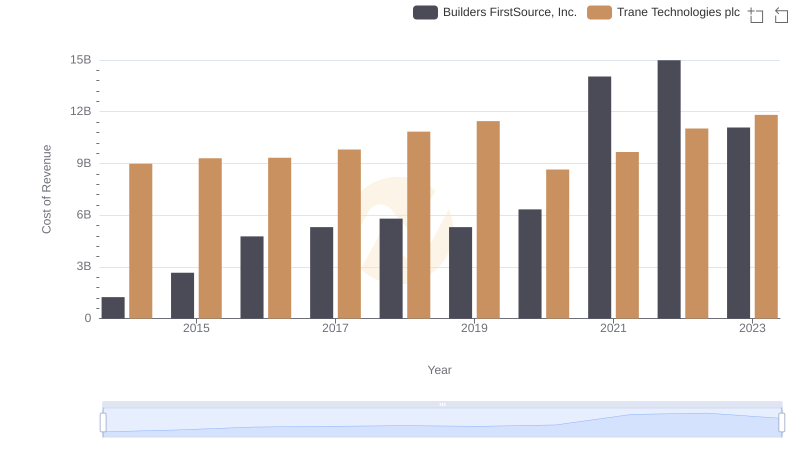
Cost of Revenue: Key Insights for Trane Technologies plc and Builders FirstSource, Inc.
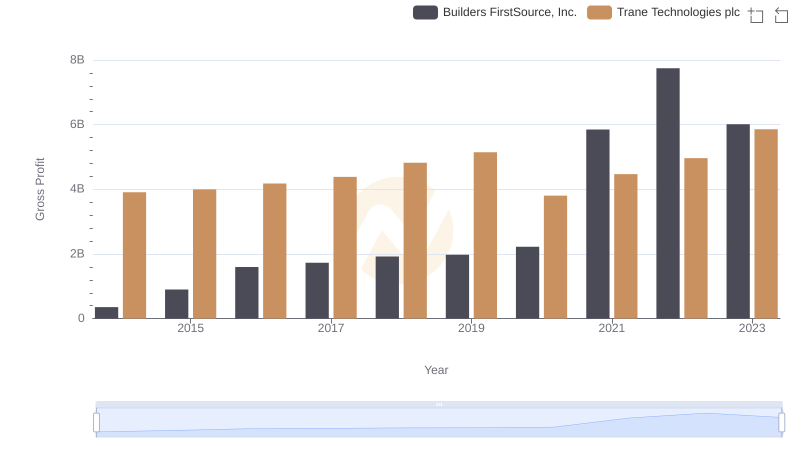
Who Generates Higher Gross Profit? Trane Technologies plc or Builders FirstSource, Inc.
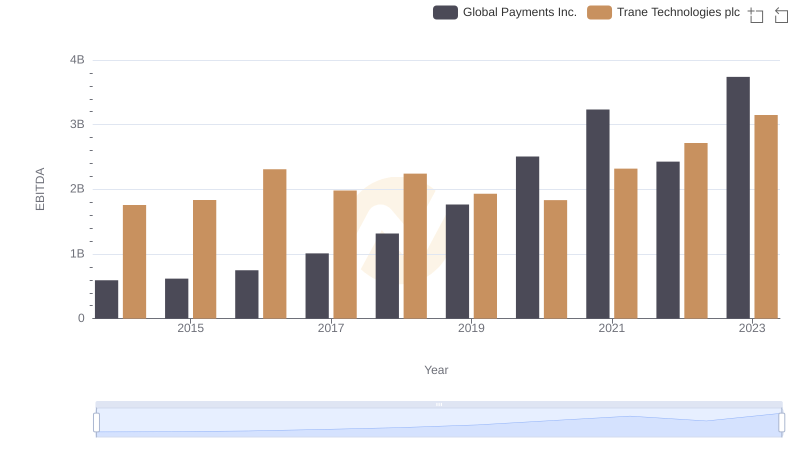
Comparative EBITDA Analysis: Trane Technologies plc vs Global Payments Inc.

Cost Management Insights: SG&A Expenses for Trane Technologies plc and Builders FirstSource, Inc.
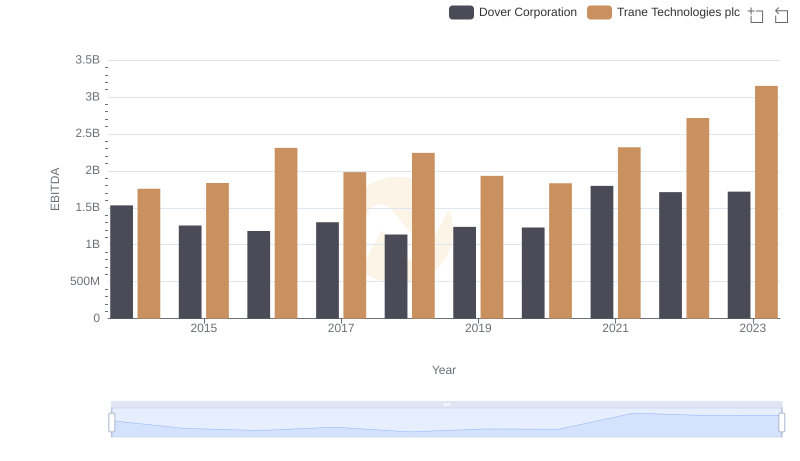
A Side-by-Side Analysis of EBITDA: Trane Technologies plc and Dover Corporation
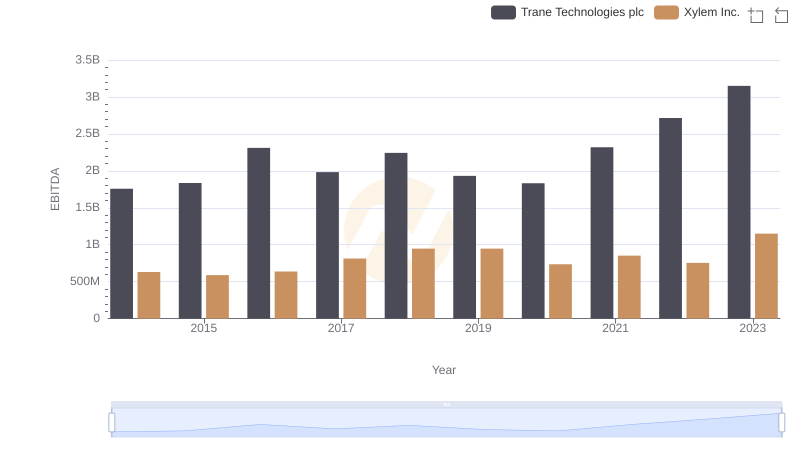
A Professional Review of EBITDA: Trane Technologies plc Compared to Xylem Inc.
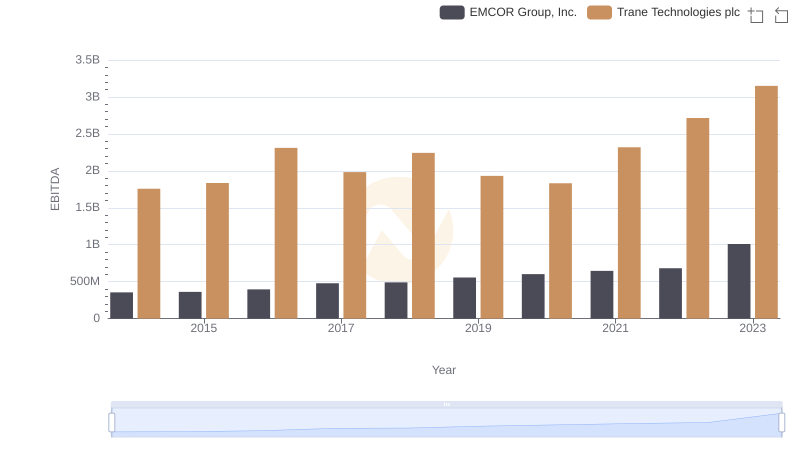
A Professional Review of EBITDA: Trane Technologies plc Compared to EMCOR Group, Inc.
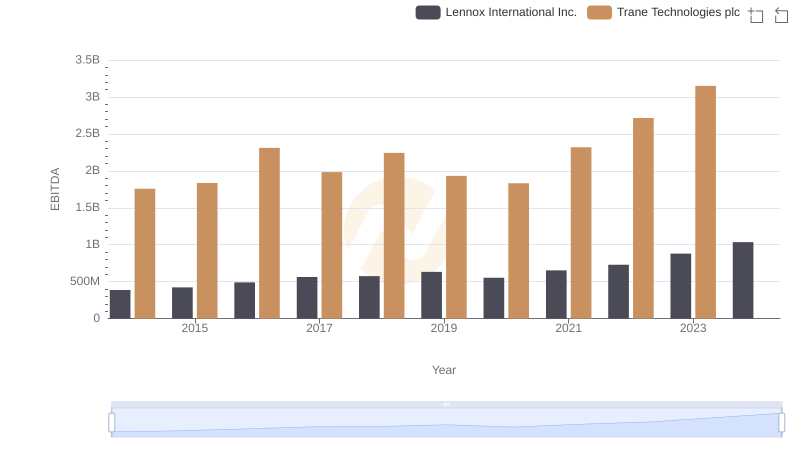
EBITDA Analysis: Evaluating Trane Technologies plc Against Lennox International Inc.
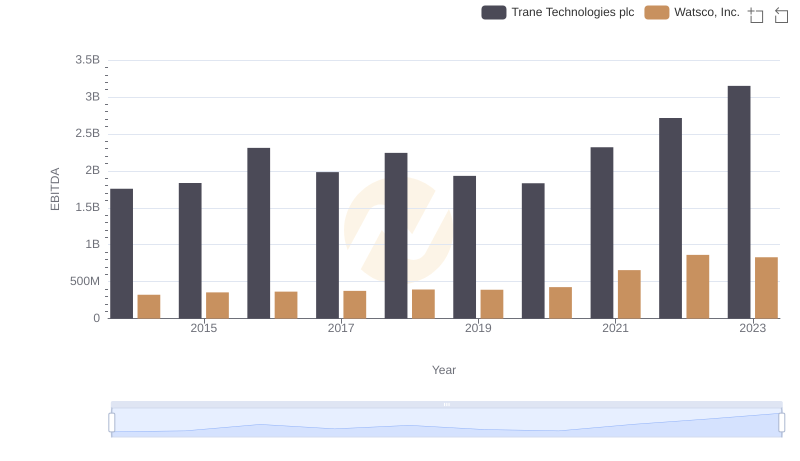
EBITDA Metrics Evaluated: Trane Technologies plc vs Watsco, Inc.
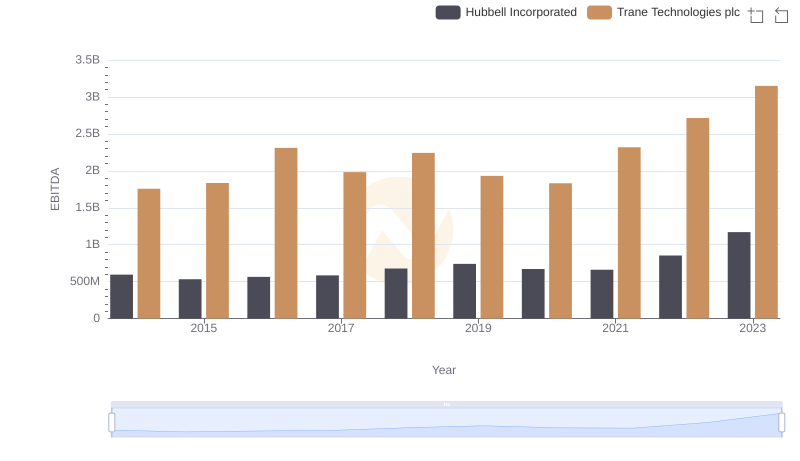
Trane Technologies plc and Hubbell Incorporated: A Detailed Examination of EBITDA Performance
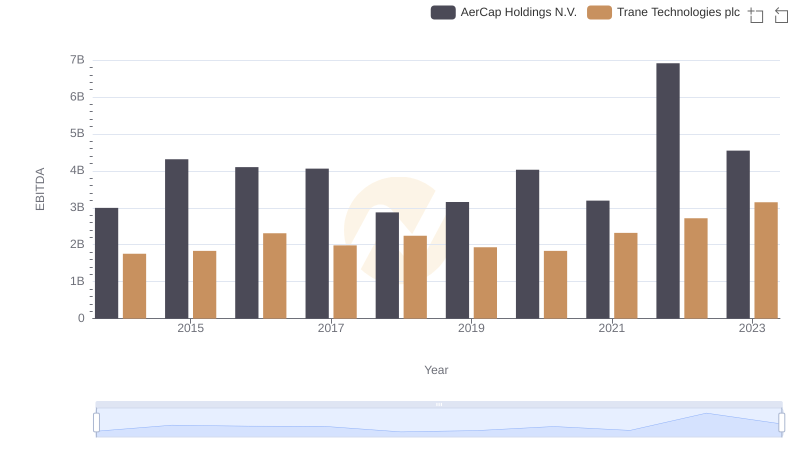
Comprehensive EBITDA Comparison: Trane Technologies plc vs AerCap Holdings N.V.