| __timestamp | Parker-Hannifin Corporation | Rockwell Automation, Inc. |
|---|---|---|
| Wednesday, January 1, 2014 | 1832903000 | 1346000000 |
| Thursday, January 1, 2015 | 1861551000 | 1359100000 |
| Friday, January 1, 2016 | 1558088000 | 1200700000 |
| Sunday, January 1, 2017 | 1846306000 | 1258400000 |
| Monday, January 1, 2018 | 2382235000 | 1568400000 |
| Tuesday, January 1, 2019 | 2513468000 | 1150200000 |
| Wednesday, January 1, 2020 | 2431500000 | 1410200000 |
| Friday, January 1, 2021 | 3092383000 | 1808300000 |
| Saturday, January 1, 2022 | 2441242000 | 1432100000 |
| Sunday, January 1, 2023 | 4071687000 | 1990700000 |
| Monday, January 1, 2024 | 5028229000 | 1567500000 |
Cracking the code
In the ever-evolving landscape of industrial automation, Parker-Hannifin Corporation and Rockwell Automation, Inc. have emerged as formidable players. Over the past decade, Parker-Hannifin has consistently outperformed Rockwell Automation in terms of EBITDA, showcasing a robust growth trajectory. From 2014 to 2024, Parker-Hannifin's EBITDA surged by approximately 175%, peaking in 2024, while Rockwell Automation experienced a more modest increase of around 16%.
This comparison underscores the dynamic nature of the industrial sector, where strategic investments and market adaptability play crucial roles in shaping financial outcomes.

Parker-Hannifin Corporation vs Rockwell Automation, Inc.: Strategic Focus on R&D Spending
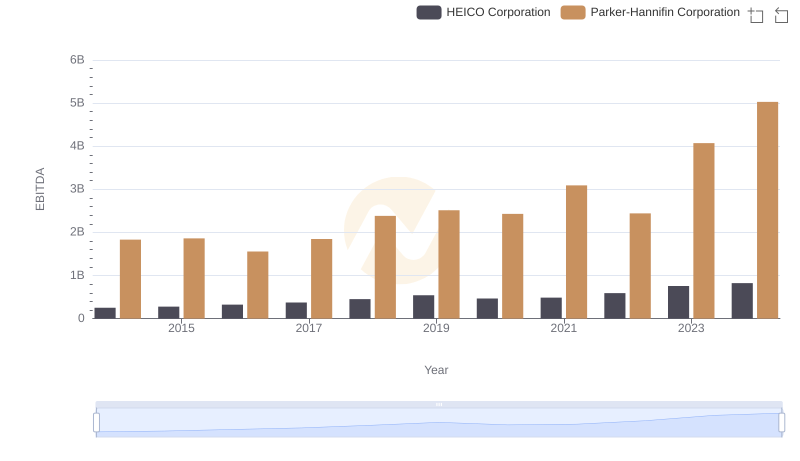
Comprehensive EBITDA Comparison: Parker-Hannifin Corporation vs HEICO Corporation
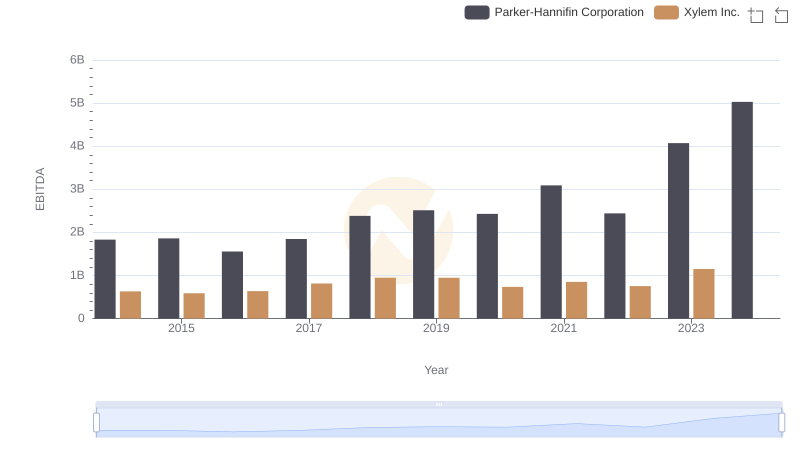
A Professional Review of EBITDA: Parker-Hannifin Corporation Compared to Xylem Inc.
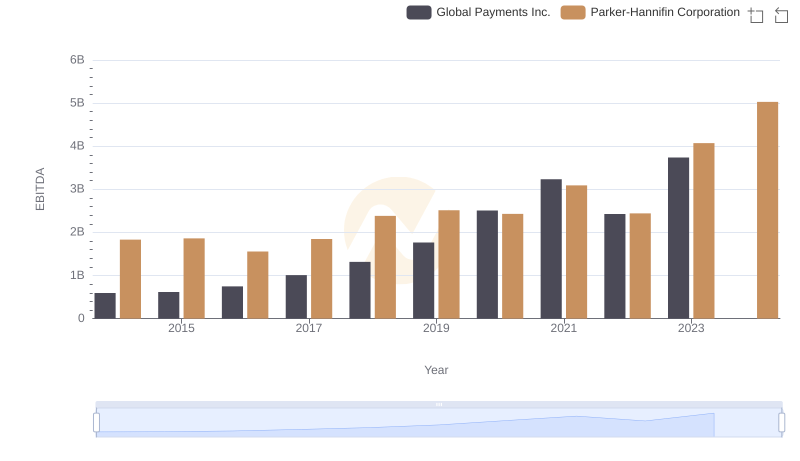
EBITDA Performance Review: Parker-Hannifin Corporation vs Global Payments Inc.
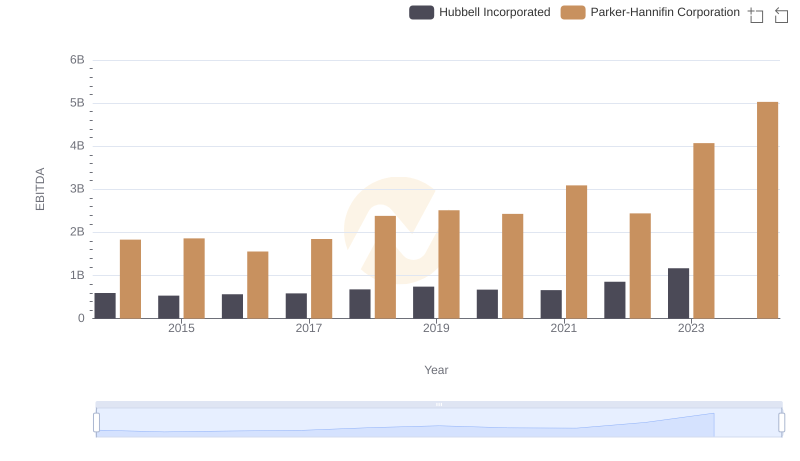
EBITDA Performance Review: Parker-Hannifin Corporation vs Hubbell Incorporated
EBITDA Analysis: Evaluating Parker-Hannifin Corporation Against Watsco, Inc.