| __timestamp | Parker-Hannifin Corporation | Xylem Inc. |
|---|---|---|
| Wednesday, January 1, 2014 | 1832903000 | 631000000 |
| Thursday, January 1, 2015 | 1861551000 | 588000000 |
| Friday, January 1, 2016 | 1558088000 | 637000000 |
| Sunday, January 1, 2017 | 1846306000 | 814000000 |
| Monday, January 1, 2018 | 2382235000 | 948000000 |
| Tuesday, January 1, 2019 | 2513468000 | 947000000 |
| Wednesday, January 1, 2020 | 2431500000 | 736000000 |
| Friday, January 1, 2021 | 3092383000 | 853000000 |
| Saturday, January 1, 2022 | 2441242000 | 755000000 |
| Sunday, January 1, 2023 | 4071687000 | 1150000000 |
| Monday, January 1, 2024 | 5028229000 |
Infusing magic into the data realm
In the ever-evolving landscape of industrial manufacturing, Parker-Hannifin Corporation and Xylem Inc. have emerged as key players. Over the past decade, Parker-Hannifin has consistently outperformed Xylem in terms of EBITDA, showcasing a robust growth trajectory. From 2014 to 2023, Parker-Hannifin's EBITDA surged by approximately 175%, peaking in 2023 with a remarkable 5 billion USD. In contrast, Xylem's EBITDA growth was more modest, increasing by about 82% over the same period, reaching its highest point in 2023 with 1.15 billion USD.
The data reveals a significant leap for Parker-Hannifin in 2023, marking a 67% increase from the previous year, while Xylem's growth was steady but less pronounced. This analysis underscores Parker-Hannifin's strategic advancements and market adaptability, positioning it as a formidable leader in the industry.
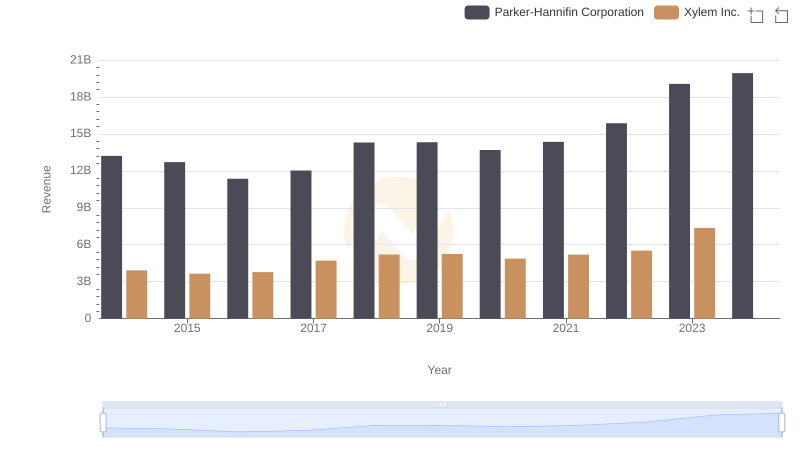
Annual Revenue Comparison: Parker-Hannifin Corporation vs Xylem Inc.
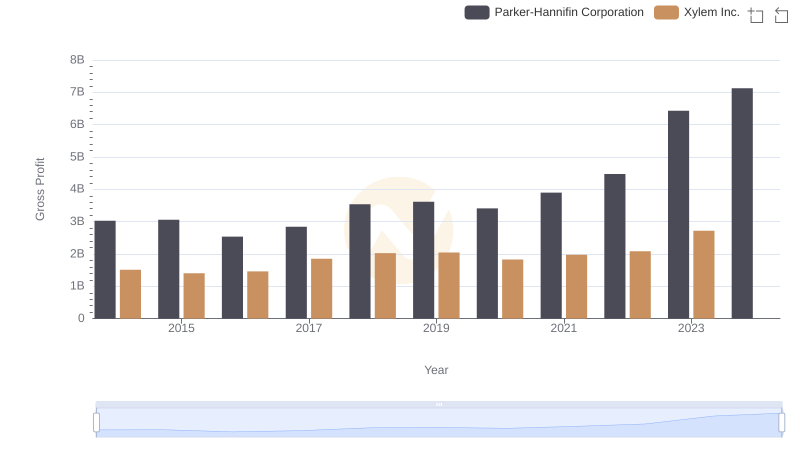
Gross Profit Analysis: Comparing Parker-Hannifin Corporation and Xylem Inc.
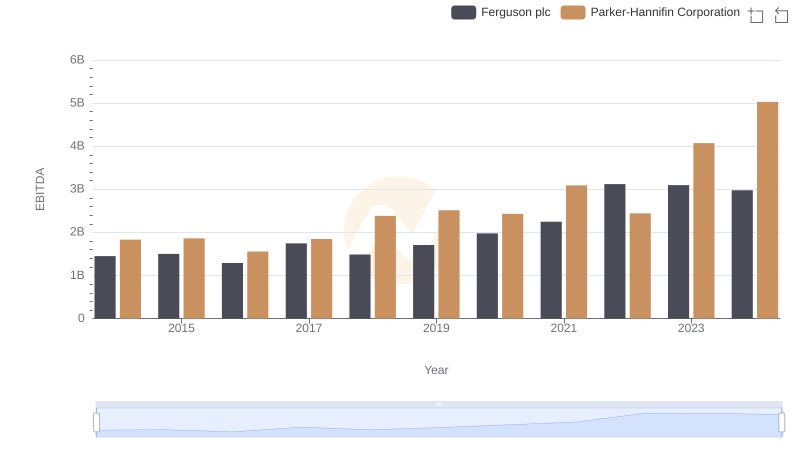
A Side-by-Side Analysis of EBITDA: Parker-Hannifin Corporation and Ferguson plc
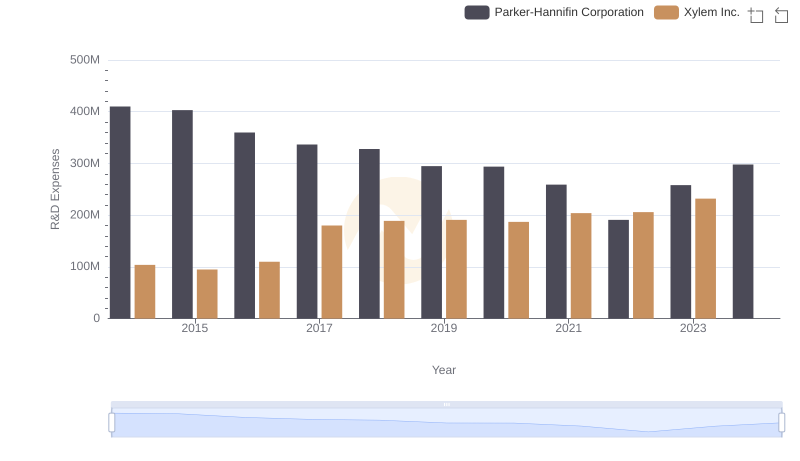
Research and Development Expenses Breakdown: Parker-Hannifin Corporation vs Xylem Inc.
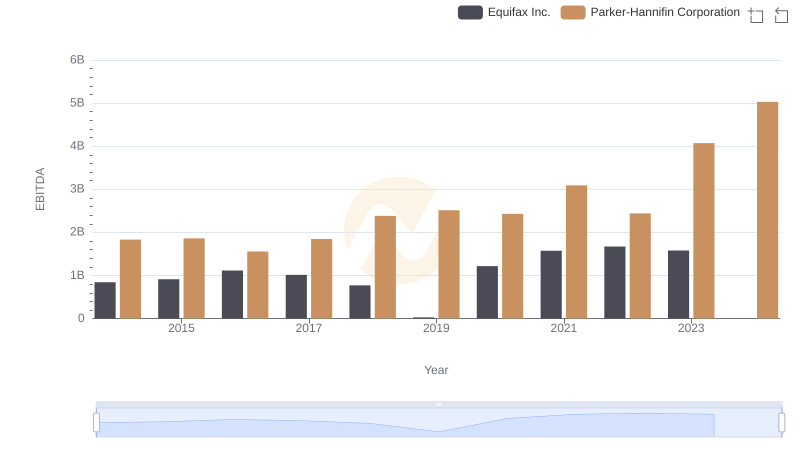
Parker-Hannifin Corporation vs Equifax Inc.: In-Depth EBITDA Performance Comparison
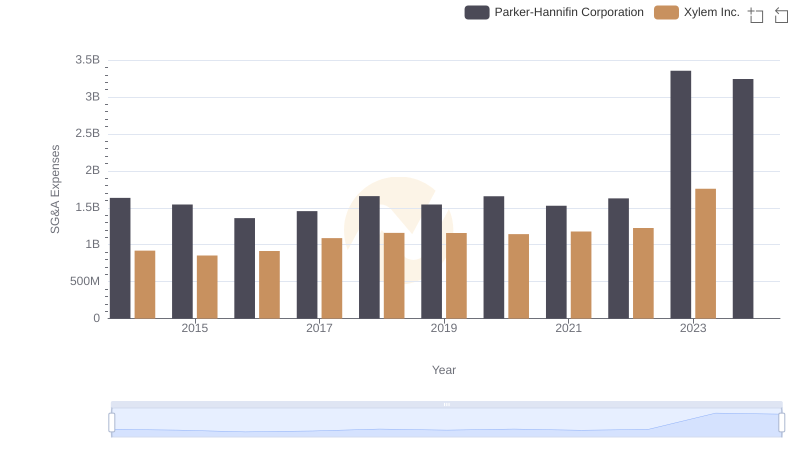
Cost Management Insights: SG&A Expenses for Parker-Hannifin Corporation and Xylem Inc.
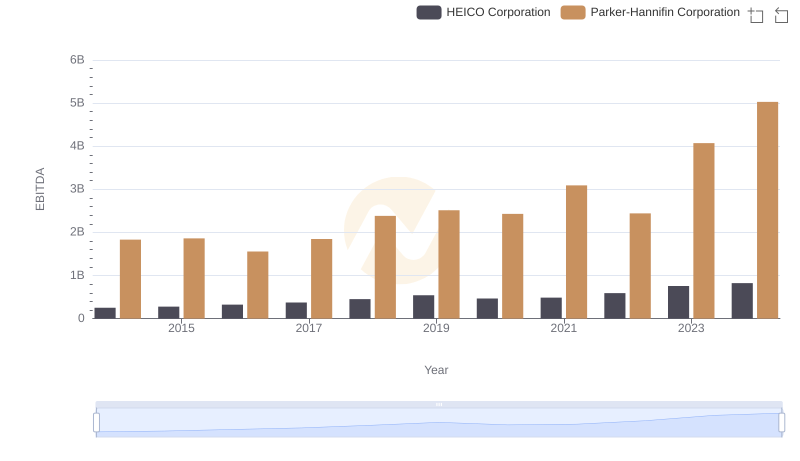
Comprehensive EBITDA Comparison: Parker-Hannifin Corporation vs HEICO Corporation
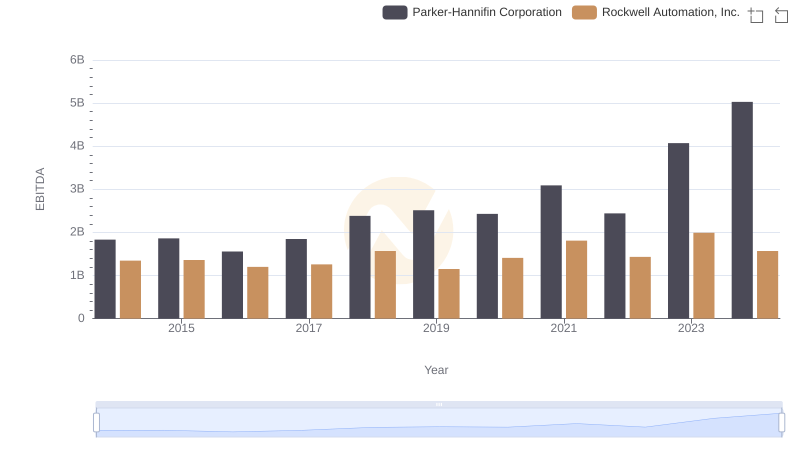
Parker-Hannifin Corporation vs Rockwell Automation, Inc.: In-Depth EBITDA Performance Comparison
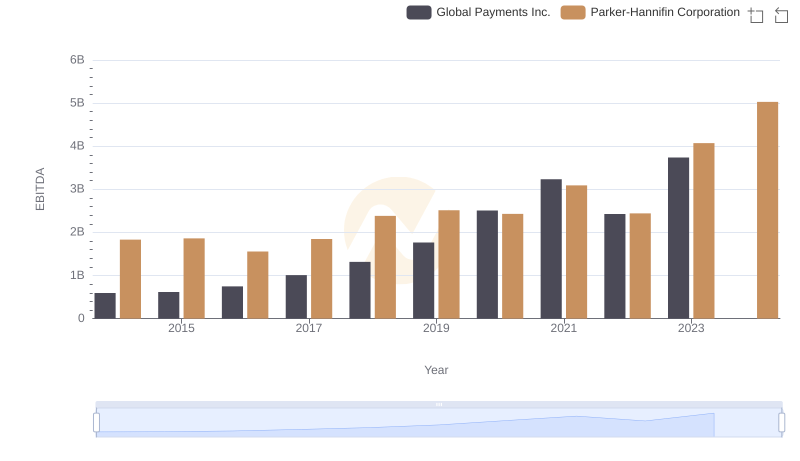
EBITDA Performance Review: Parker-Hannifin Corporation vs Global Payments Inc.
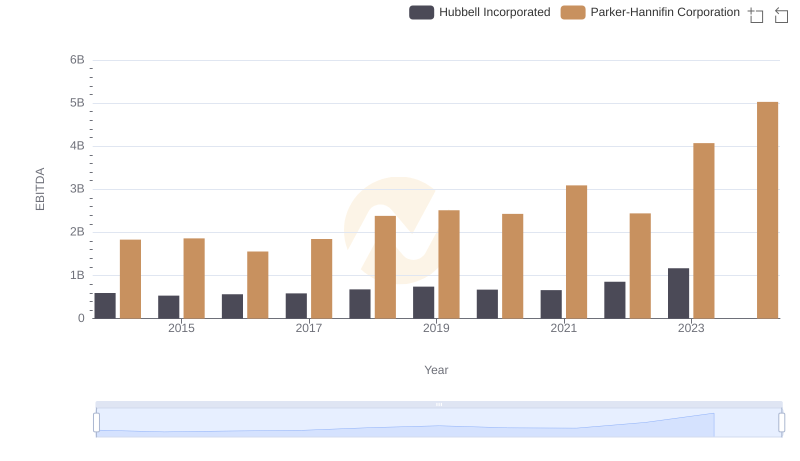
EBITDA Performance Review: Parker-Hannifin Corporation vs Hubbell Incorporated