| __timestamp | Parker-Hannifin Corporation | Verisk Analytics, Inc. |
|---|---|---|
| Wednesday, January 1, 2014 | 1832903000 | 776000000 |
| Thursday, January 1, 2015 | 1861551000 | 972500000 |
| Friday, January 1, 2016 | 1558088000 | 985300000 |
| Sunday, January 1, 2017 | 1846306000 | 1047800000 |
| Monday, January 1, 2018 | 2382235000 | 1145500000 |
| Tuesday, January 1, 2019 | 2513468000 | 1018900000 |
| Wednesday, January 1, 2020 | 2431500000 | 1393800000 |
| Friday, January 1, 2021 | 3092383000 | 1163700000 |
| Saturday, January 1, 2022 | 2441242000 | 1639800000 |
| Sunday, January 1, 2023 | 4071687000 | 1424100000 |
| Monday, January 1, 2024 | 5028229000 |
Cracking the code
In the world of industrial and analytics giants, Parker-Hannifin Corporation and Verisk Analytics, Inc. have carved out significant niches. Over the past decade, Parker-Hannifin has demonstrated a robust EBITDA growth, peaking in 2024 with a staggering 175% increase from its 2014 figures. This growth trajectory underscores its strategic prowess in the industrial sector.
Conversely, Verisk Analytics, a leader in data analytics, has shown a steady EBITDA increase, with a notable 111% rise from 2014 to 2022. However, data for 2024 remains elusive, leaving room for speculation on its future performance.
This comparison highlights the dynamic nature of these industries, where strategic decisions and market conditions play pivotal roles in shaping financial outcomes. As we look to the future, the question remains: will Parker-Hannifin maintain its momentum, and can Verisk Analytics close the gap?
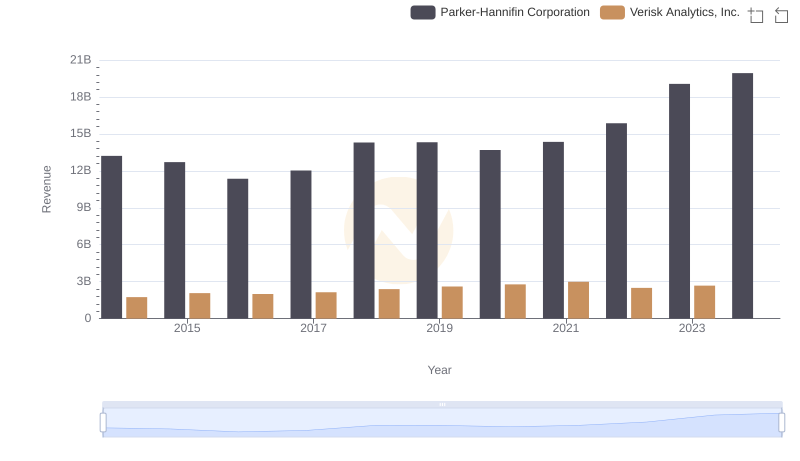
Breaking Down Revenue Trends: Parker-Hannifin Corporation vs Verisk Analytics, Inc.
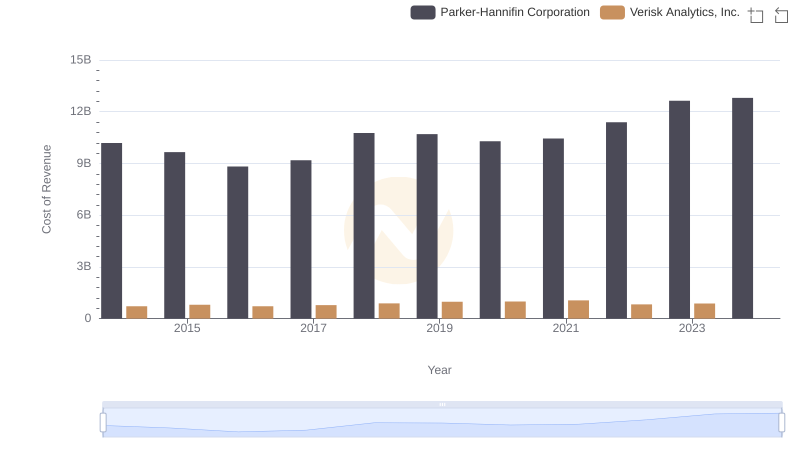
Cost of Revenue Comparison: Parker-Hannifin Corporation vs Verisk Analytics, Inc.
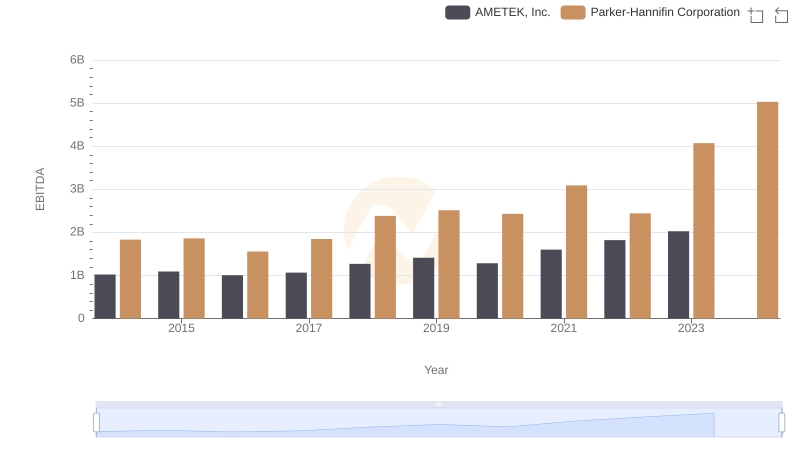
Parker-Hannifin Corporation and AMETEK, Inc.: A Detailed Examination of EBITDA Performance
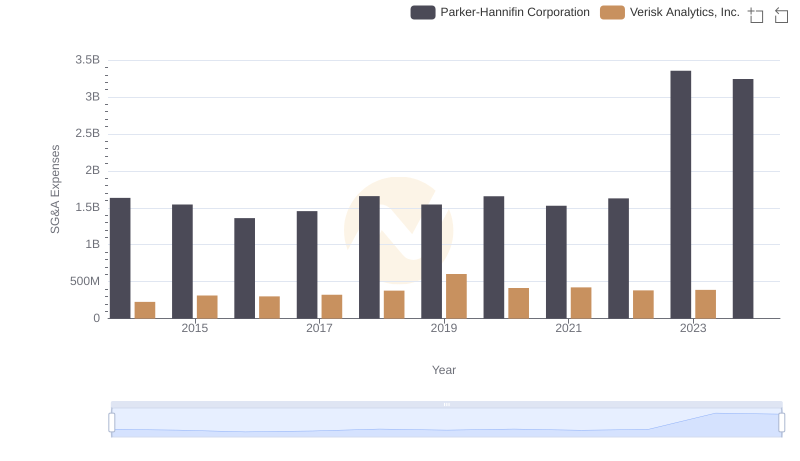
Comparing SG&A Expenses: Parker-Hannifin Corporation vs Verisk Analytics, Inc. Trends and Insights
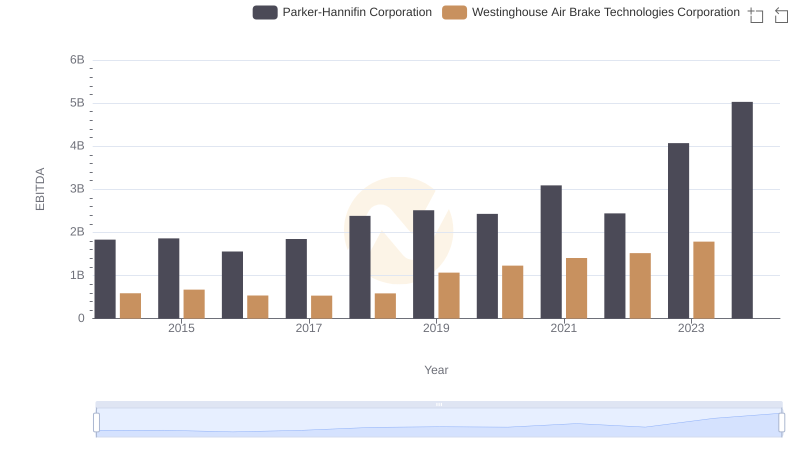
Parker-Hannifin Corporation vs Westinghouse Air Brake Technologies Corporation: In-Depth EBITDA Performance Comparison
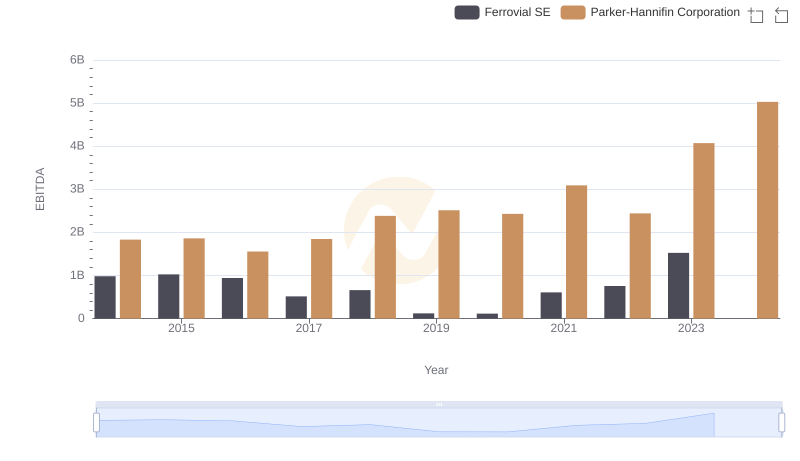
Professional EBITDA Benchmarking: Parker-Hannifin Corporation vs Ferrovial SE
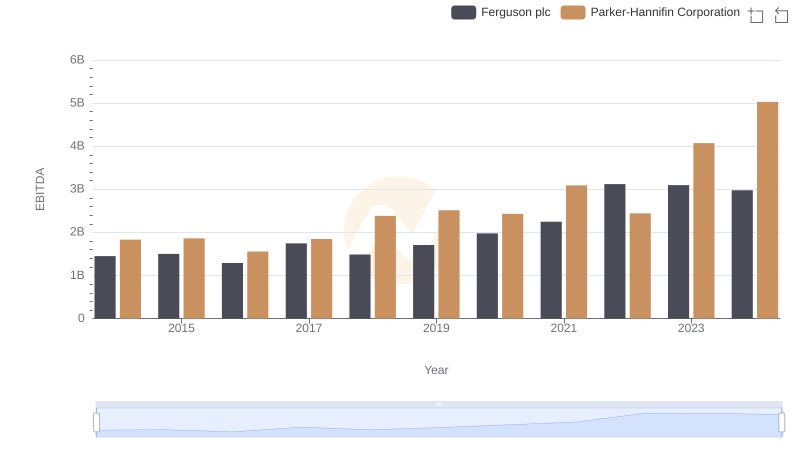
A Side-by-Side Analysis of EBITDA: Parker-Hannifin Corporation and Ferguson plc
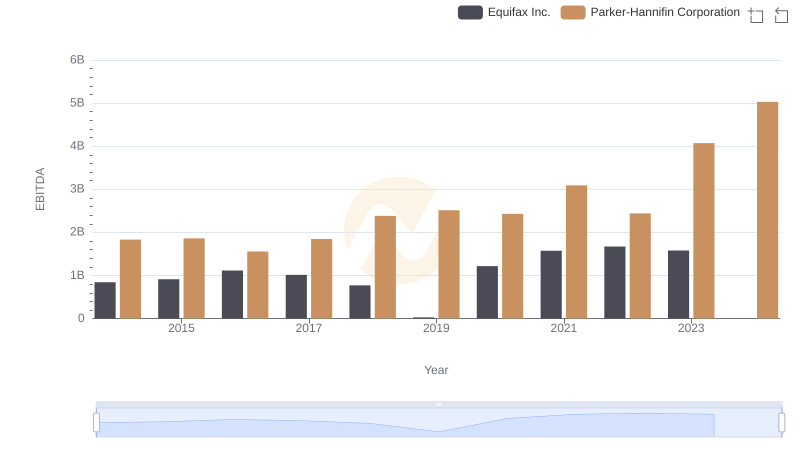
Parker-Hannifin Corporation vs Equifax Inc.: In-Depth EBITDA Performance Comparison