| __timestamp | Global Payments Inc. | Stanley Black & Decker, Inc. |
|---|---|---|
| Wednesday, January 1, 2014 | 594102000 | 1975400000 |
| Thursday, January 1, 2015 | 618109000 | 1741900000 |
| Friday, January 1, 2016 | 748136000 | 1810200000 |
| Sunday, January 1, 2017 | 1010019000 | 2196000000 |
| Monday, January 1, 2018 | 1315968000 | 1791200000 |
| Tuesday, January 1, 2019 | 1764994000 | 1920600000 |
| Wednesday, January 1, 2020 | 2508393000 | 2004200000 |
| Friday, January 1, 2021 | 3233589000 | 2345500000 |
| Saturday, January 1, 2022 | 2427684000 | 942800000 |
| Sunday, January 1, 2023 | 3606789000 | 802700000 |
| Monday, January 1, 2024 | 2333605000 | 286300000 |
Igniting the spark of knowledge
In the ever-evolving landscape of corporate finance, EBITDA serves as a crucial indicator of a company's operational performance. Over the past decade, Global Payments Inc. and Stanley Black & Decker, Inc. have showcased contrasting trajectories in their EBITDA growth.
From 2014 to 2023, Global Payments Inc. experienced a remarkable growth, with its EBITDA surging by over 500%, peaking in 2023. This growth reflects the company's strategic expansions and robust market positioning. In contrast, Stanley Black & Decker, Inc. faced a more turbulent journey. Despite a strong start in 2014, their EBITDA saw a decline of approximately 60% by 2023, highlighting challenges in maintaining consistent profitability.
This comparison underscores the dynamic nature of business environments and the importance of strategic agility in sustaining financial health.
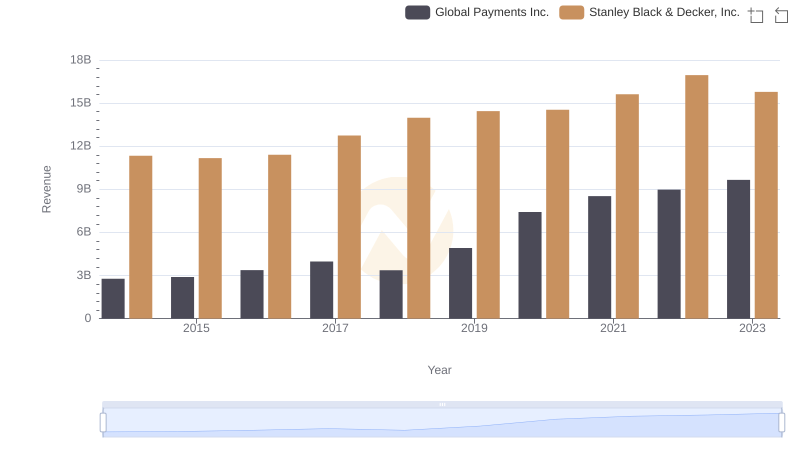
Global Payments Inc. vs Stanley Black & Decker, Inc.: Examining Key Revenue Metrics
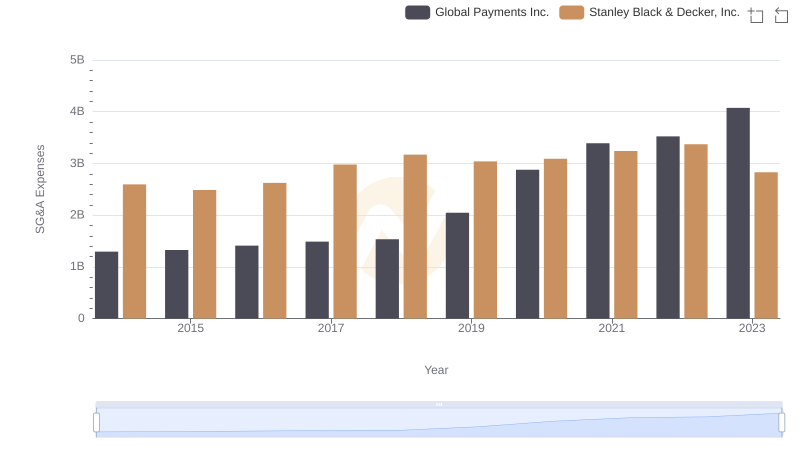
Breaking Down SG&A Expenses: Global Payments Inc. vs Stanley Black & Decker, Inc.
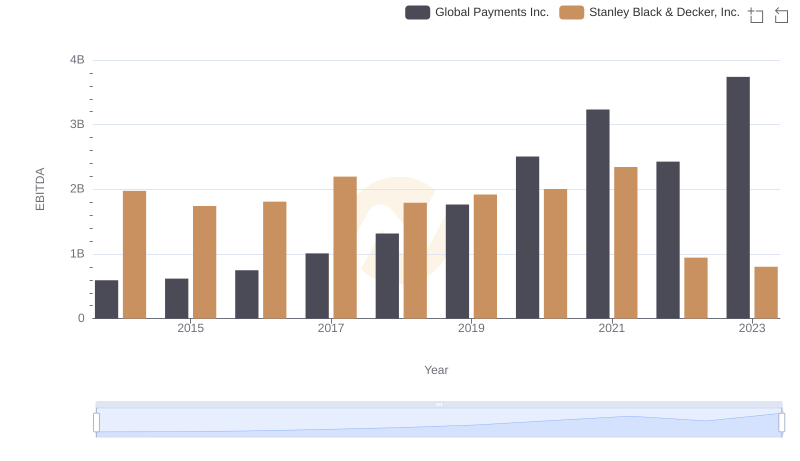
EBITDA Metrics Evaluated: Global Payments Inc. vs Stanley Black & Decker, Inc.

Revenue Insights: Global Payments Inc. and Stanley Black & Decker, Inc. Performance Compared
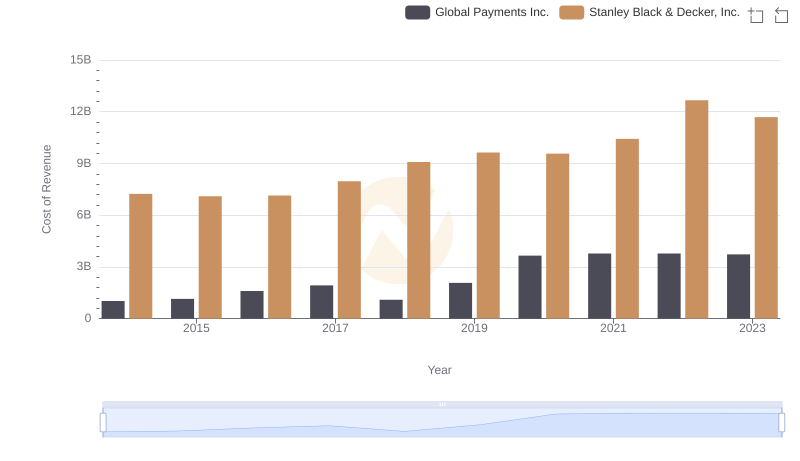
Cost of Revenue Trends: Global Payments Inc. vs Stanley Black & Decker, Inc.

Breaking Down SG&A Expenses: Global Payments Inc. vs Stanley Black & Decker, Inc.
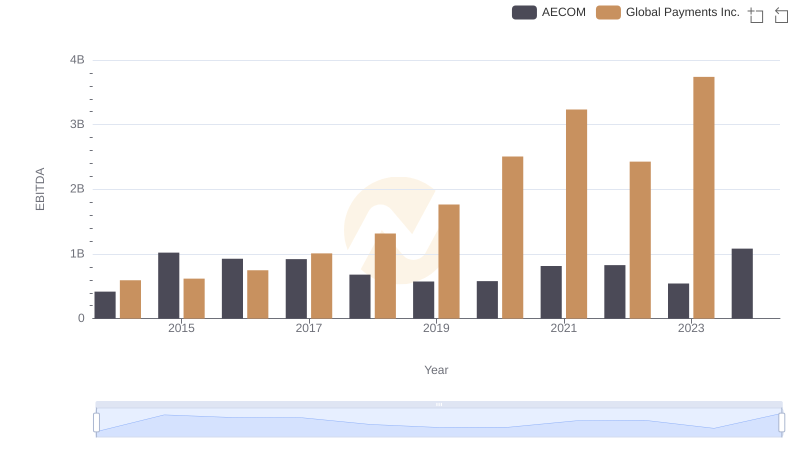
A Professional Review of EBITDA: Global Payments Inc. Compared to AECOM
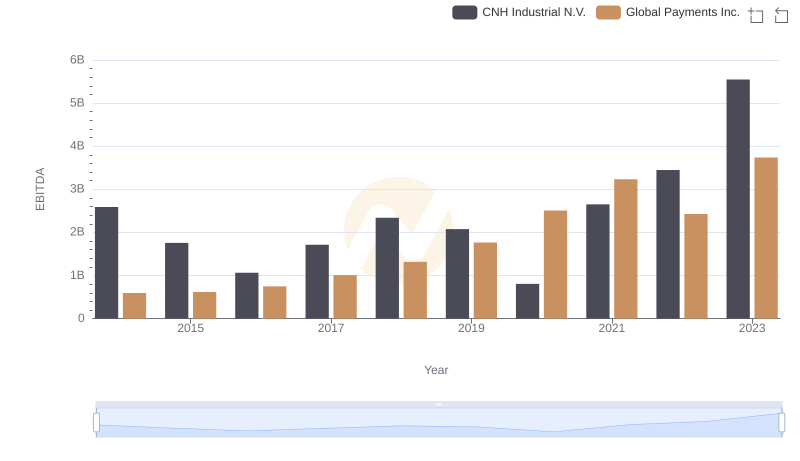
A Side-by-Side Analysis of EBITDA: Global Payments Inc. and CNH Industrial N.V.