| __timestamp | Cintas Corporation | Curtiss-Wright Corporation |
|---|---|---|
| Wednesday, January 1, 2014 | 793811000 | 401669000 |
| Thursday, January 1, 2015 | 877761000 | 412042000 |
| Friday, January 1, 2016 | 933728000 | 405217000 |
| Sunday, January 1, 2017 | 968293000 | 441085000 |
| Monday, January 1, 2018 | 1227852000 | 493171000 |
| Tuesday, January 1, 2019 | 1564228000 | 530221000 |
| Wednesday, January 1, 2020 | 1542737000 | 414499000 |
| Friday, January 1, 2021 | 1773591000 | 509134000 |
| Saturday, January 1, 2022 | 1990046000 | 548202000 |
| Sunday, January 1, 2023 | 2221676000 | 630635000 |
| Monday, January 1, 2024 | 2523857000 | 674592000 |
Data in motion
In the competitive landscape of corporate America, Cintas Corporation and Curtiss-Wright Corporation have showcased remarkable financial trajectories over the past decade. Since 2014, Cintas has consistently outperformed Curtiss-Wright in terms of EBITDA, reflecting a robust growth strategy. By 2023, Cintas' EBITDA surged by approximately 180% from its 2014 levels, reaching a peak of $2.22 billion. In contrast, Curtiss-Wright experienced a more modest growth of around 57%, with its EBITDA climbing to $630 million in the same period.
This comparison underscores the dynamic nature of financial performance in the industrial sector.
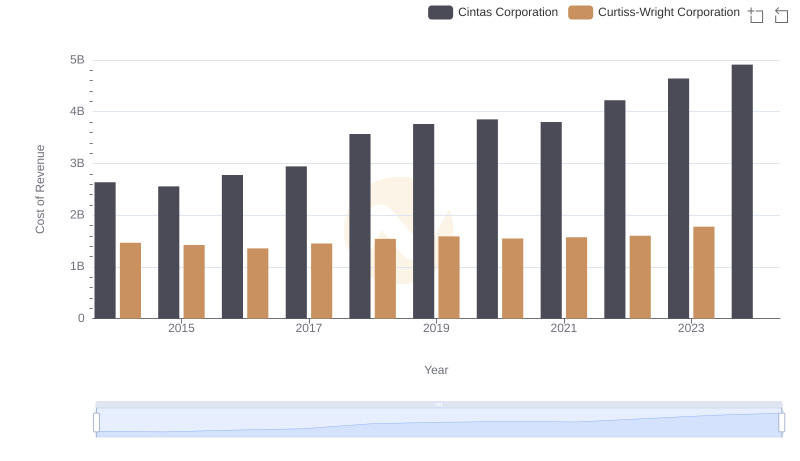
Cost of Revenue Comparison: Cintas Corporation vs Curtiss-Wright Corporation

Who Generates Higher Gross Profit? Cintas Corporation or Curtiss-Wright Corporation
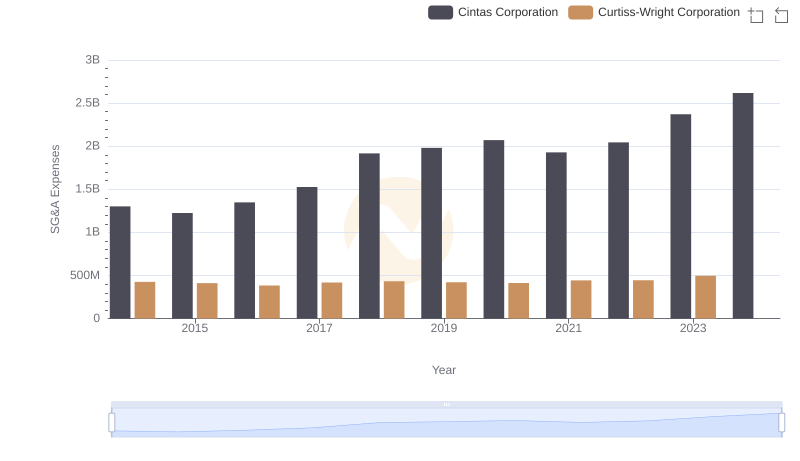
Who Optimizes SG&A Costs Better? Cintas Corporation or Curtiss-Wright Corporation
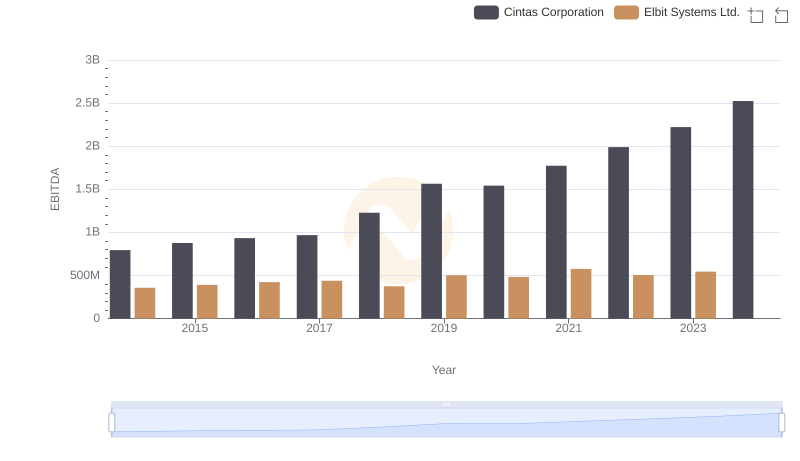
Comprehensive EBITDA Comparison: Cintas Corporation vs Elbit Systems Ltd.
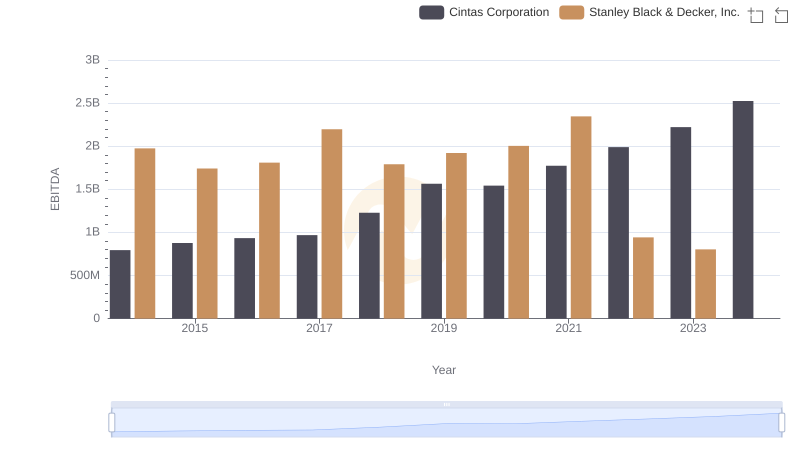
Comprehensive EBITDA Comparison: Cintas Corporation vs Stanley Black & Decker, Inc.
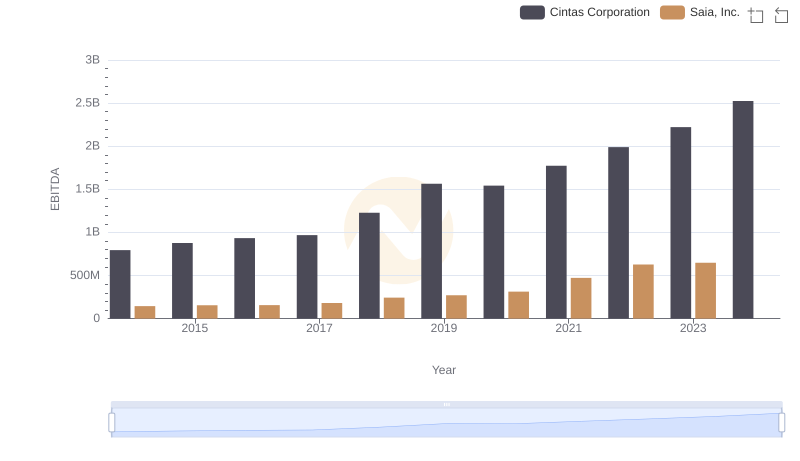
Cintas Corporation and Saia, Inc.: A Detailed Examination of EBITDA Performance
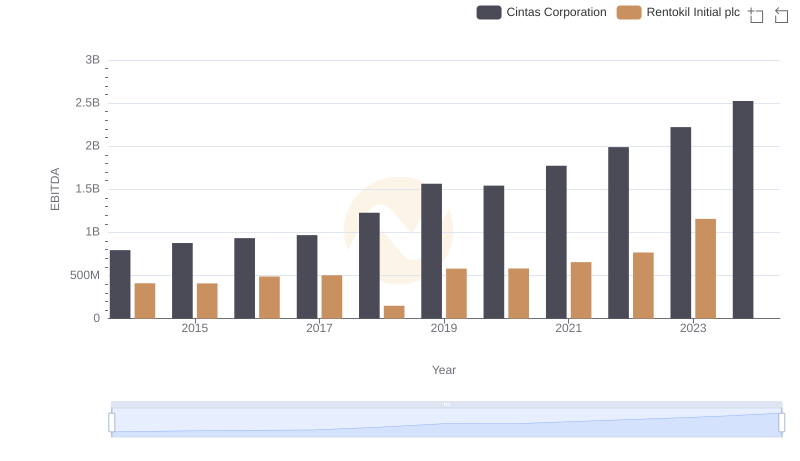
Comparative EBITDA Analysis: Cintas Corporation vs Rentokil Initial plc
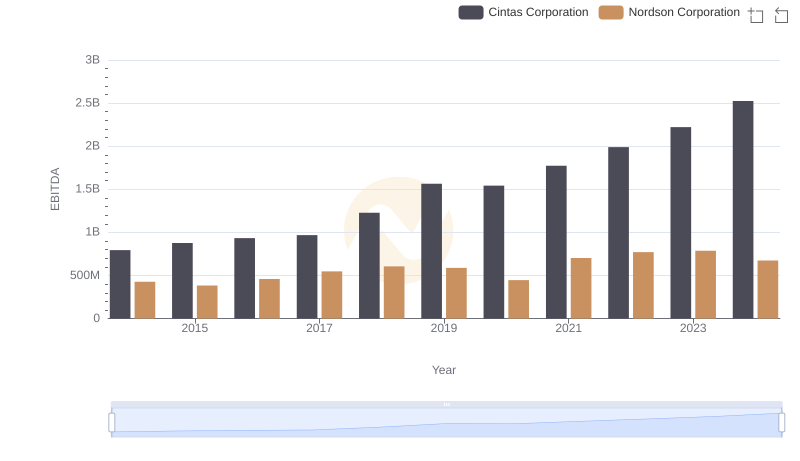
Comparative EBITDA Analysis: Cintas Corporation vs Nordson Corporation
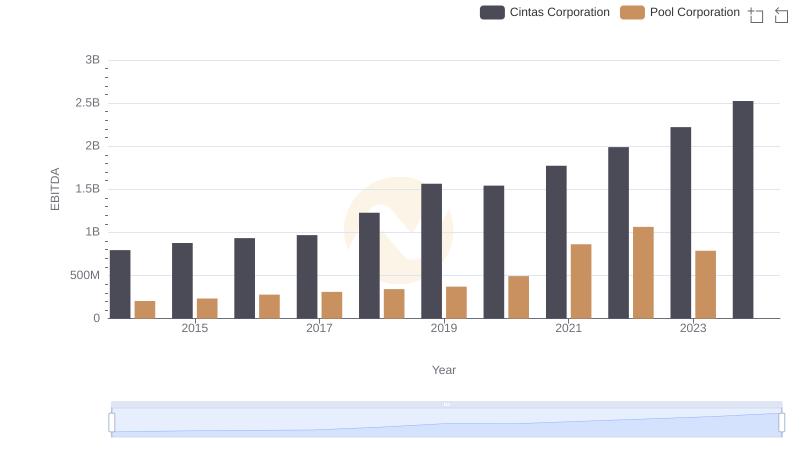
Comparative EBITDA Analysis: Cintas Corporation vs Pool Corporation