| __timestamp | Automatic Data Processing, Inc. | TFI International Inc. |
|---|---|---|
| Wednesday, January 1, 2014 | 2616900000 | 334908602 |
| Thursday, January 1, 2015 | 2355100000 | 314924803 |
| Friday, January 1, 2016 | 2579500000 | 325584405 |
| Sunday, January 1, 2017 | 2927200000 | 517899005 |
| Monday, January 1, 2018 | 2762900000 | 521265317 |
| Tuesday, January 1, 2019 | 3544500000 | 674440000 |
| Wednesday, January 1, 2020 | 3769700000 | 709296000 |
| Friday, January 1, 2021 | 3931600000 | 1358717000 |
| Saturday, January 1, 2022 | 4405500000 | 1561728000 |
| Sunday, January 1, 2023 | 5244600000 | 1194213000 |
| Monday, January 1, 2024 | 5800000000 |
Cracking the code
In the ever-evolving landscape of corporate finance, EBITDA serves as a crucial indicator of a company's operational efficiency. Over the past decade, Automatic Data Processing, Inc. (ADP) and TFI International Inc. have showcased contrasting trajectories in their EBITDA performance. From 2014 to 2023, ADP's EBITDA surged by approximately 122%, reflecting its robust growth strategy and market adaptability. In contrast, TFI International experienced a more modest increase of around 256% until 2022, before a slight dip in 2023. This divergence highlights ADP's consistent upward momentum, while TFI's journey underscores the challenges and opportunities in the logistics sector. As we look to the future, the absence of data for TFI in 2024 leaves room for speculation on its strategic pivots. This comparison not only offers insights into their financial health but also sets the stage for future market dynamics.
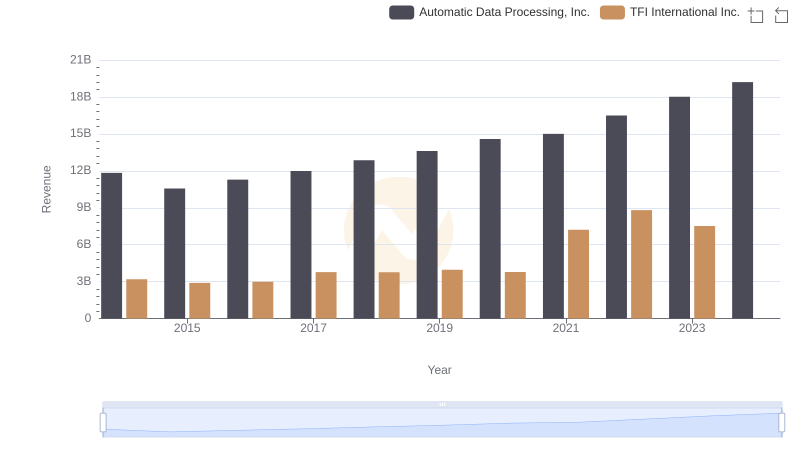
Comparing Revenue Performance: Automatic Data Processing, Inc. or TFI International Inc.?
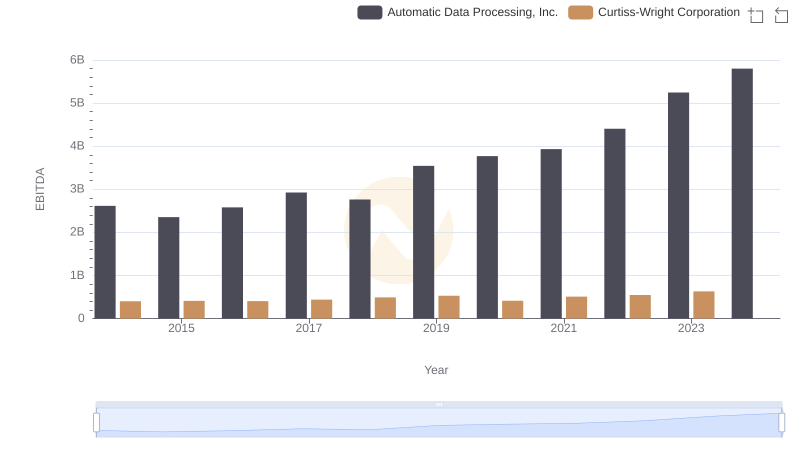
A Side-by-Side Analysis of EBITDA: Automatic Data Processing, Inc. and Curtiss-Wright Corporation

A Professional Review of EBITDA: Automatic Data Processing, Inc. Compared to U-Haul Holding Company

Comprehensive EBITDA Comparison: Automatic Data Processing, Inc. vs Elbit Systems Ltd.

Automatic Data Processing, Inc. vs Nordson Corporation: In-Depth EBITDA Performance Comparison
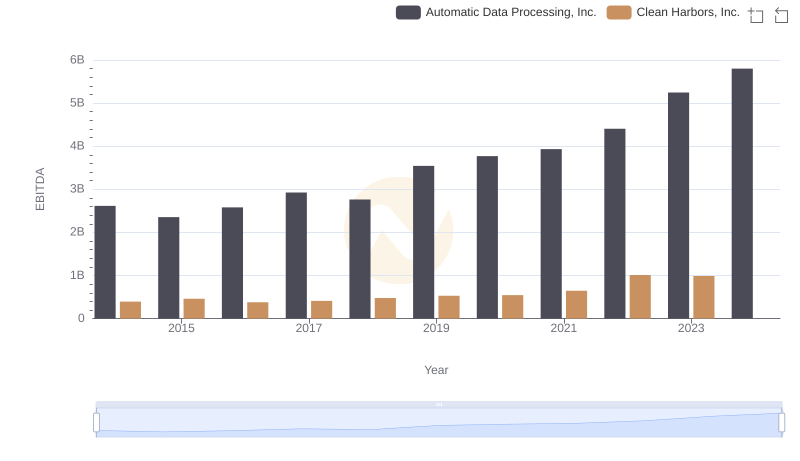
EBITDA Performance Review: Automatic Data Processing, Inc. vs Clean Harbors, Inc.
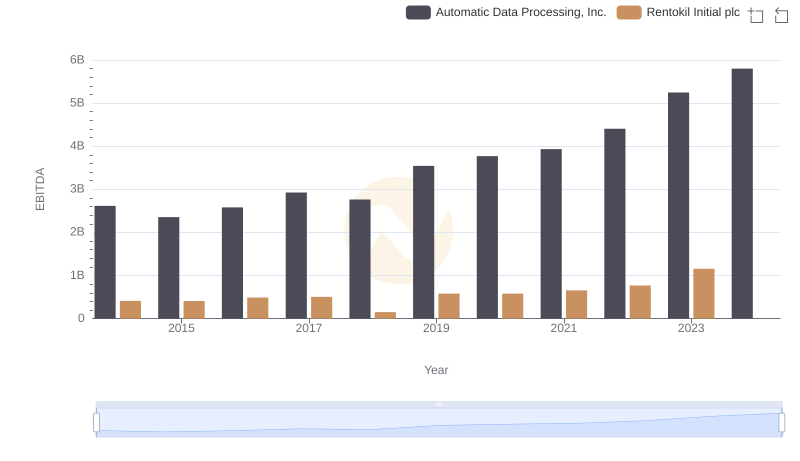
A Side-by-Side Analysis of EBITDA: Automatic Data Processing, Inc. and Rentokil Initial plc

EBITDA Performance Review: Automatic Data Processing, Inc. vs ITT Inc.