| __timestamp | Automatic Data Processing, Inc. | Curtiss-Wright Corporation |
|---|---|---|
| Wednesday, January 1, 2014 | 2616900000 | 401669000 |
| Thursday, January 1, 2015 | 2355100000 | 412042000 |
| Friday, January 1, 2016 | 2579500000 | 405217000 |
| Sunday, January 1, 2017 | 2927200000 | 441085000 |
| Monday, January 1, 2018 | 2762900000 | 493171000 |
| Tuesday, January 1, 2019 | 3544500000 | 530221000 |
| Wednesday, January 1, 2020 | 3769700000 | 414499000 |
| Friday, January 1, 2021 | 3931600000 | 509134000 |
| Saturday, January 1, 2022 | 4405500000 | 548202000 |
| Sunday, January 1, 2023 | 5244600000 | 630635000 |
| Monday, January 1, 2024 | 5800000000 | 674592000 |
In pursuit of knowledge
In the ever-evolving landscape of corporate finance, EBITDA serves as a crucial metric for evaluating a company's operational performance. Over the past decade, Automatic Data Processing, Inc. (ADP) and Curtiss-Wright Corporation have demonstrated distinct trajectories in their EBITDA growth.
From 2014 to 2023, ADP's EBITDA surged by approximately 122%, reflecting its robust business model and strategic initiatives. In contrast, Curtiss-Wright Corporation experienced a more modest growth of around 57% during the same period. Notably, ADP's EBITDA in 2023 was nearly eight times that of Curtiss-Wright, underscoring its dominant market position.
While ADP's EBITDA continued to rise in 2024, data for Curtiss-Wright remains unavailable, highlighting potential gaps in financial reporting. This analysis provides a compelling snapshot of how these two industry giants have navigated the financial landscape, offering valuable insights for investors and analysts alike.
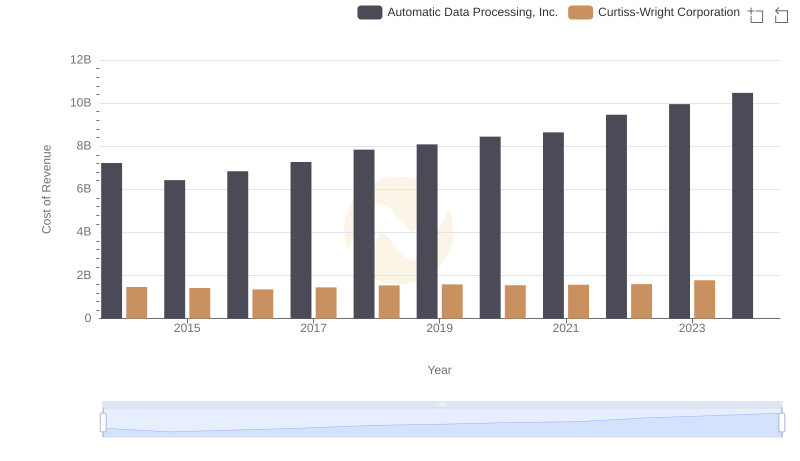
Comparing Cost of Revenue Efficiency: Automatic Data Processing, Inc. vs Curtiss-Wright Corporation
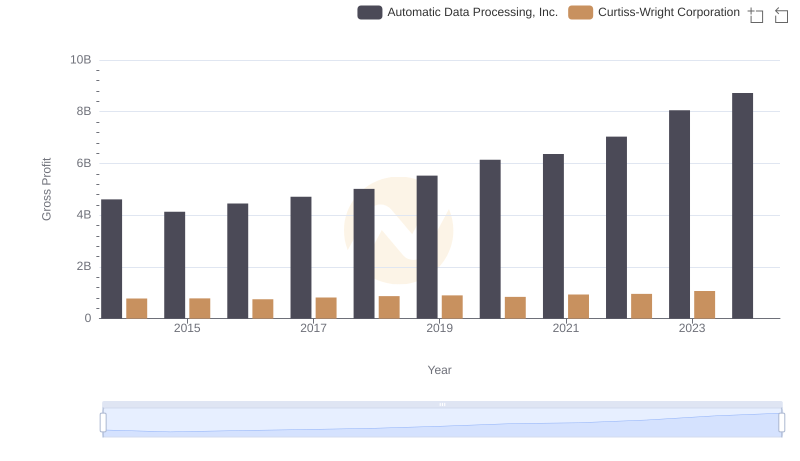
Who Generates Higher Gross Profit? Automatic Data Processing, Inc. or Curtiss-Wright Corporation
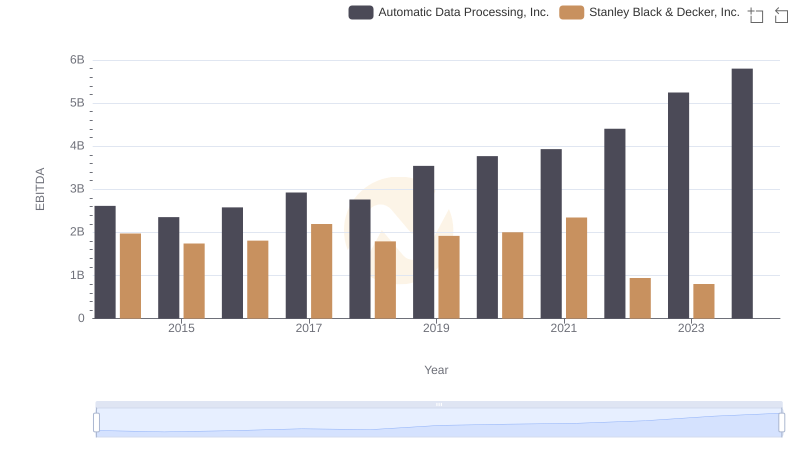
Automatic Data Processing, Inc. vs Stanley Black & Decker, Inc.: In-Depth EBITDA Performance Comparison
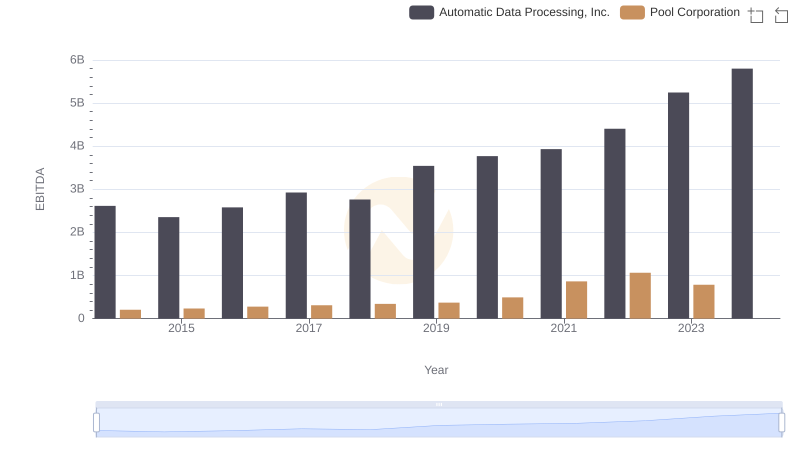
Professional EBITDA Benchmarking: Automatic Data Processing, Inc. vs Pool Corporation
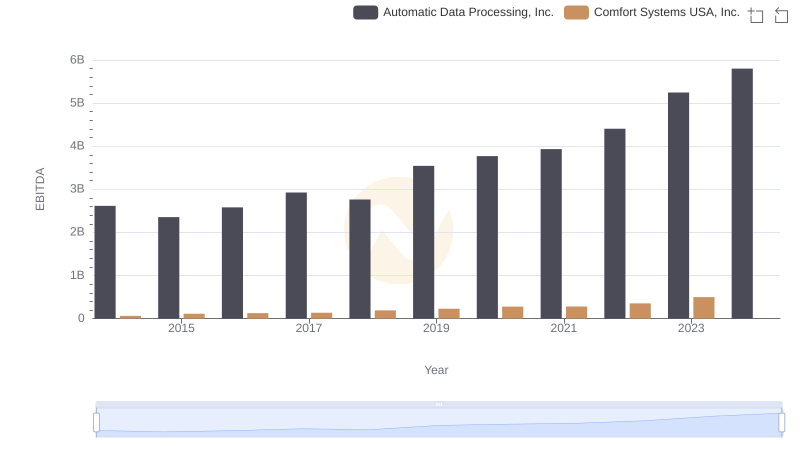
EBITDA Analysis: Evaluating Automatic Data Processing, Inc. Against Comfort Systems USA, Inc.

A Professional Review of EBITDA: Automatic Data Processing, Inc. Compared to U-Haul Holding Company

Comprehensive EBITDA Comparison: Automatic Data Processing, Inc. vs Elbit Systems Ltd.

Automatic Data Processing, Inc. vs Nordson Corporation: In-Depth EBITDA Performance Comparison
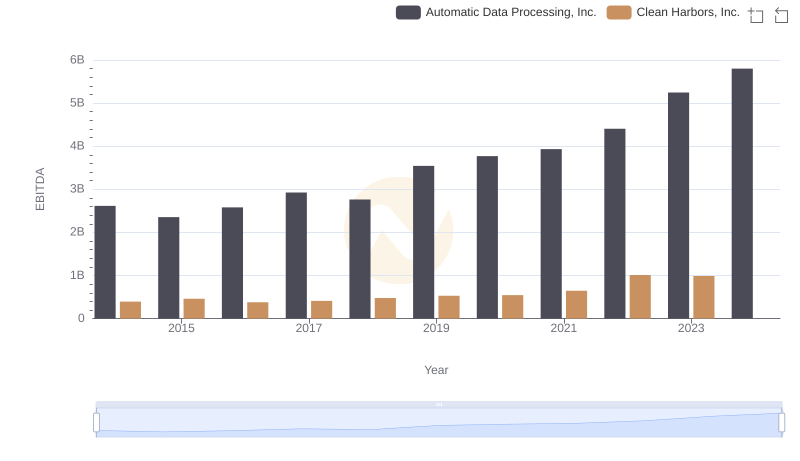
EBITDA Performance Review: Automatic Data Processing, Inc. vs Clean Harbors, Inc.