| __timestamp | Automatic Data Processing, Inc. | U-Haul Holding Company |
|---|---|---|
| Wednesday, January 1, 2014 | 2616900000 | 923383000 |
| Thursday, January 1, 2015 | 2355100000 | 1076520000 |
| Friday, January 1, 2016 | 2579500000 | 1255474000 |
| Sunday, January 1, 2017 | 2927200000 | 1195593000 |
| Monday, January 1, 2018 | 2762900000 | 1123974000 |
| Tuesday, January 1, 2019 | 3544500000 | 1200955000 |
| Wednesday, January 1, 2020 | 3769700000 | 1202436000 |
| Friday, January 1, 2021 | 3931600000 | 1627442000 |
| Saturday, January 1, 2022 | 4405500000 | 2337788000 |
| Sunday, January 1, 2023 | 5244600000 | 2183839000 |
| Monday, January 1, 2024 | 5800000000 | 1919656000 |
Igniting the spark of knowledge
In the ever-evolving landscape of corporate finance, EBITDA serves as a crucial metric for evaluating a company's operational performance. Over the past decade, Automatic Data Processing, Inc. (ADP) and U-Haul Holding Company have showcased contrasting trajectories in their EBITDA growth.
From 2014 to 2024, ADP's EBITDA surged by approximately 122%, reflecting its robust business model and strategic initiatives. In contrast, U-Haul's EBITDA grew by around 108%, indicating steady, albeit slower, growth. Notably, ADP's EBITDA consistently outpaced U-Haul's, with 2024 figures showing ADP's EBITDA nearly three times that of U-Haul's.
This comparison highlights ADP's strong market position and operational efficiency, while U-Haul's growth underscores its resilience in a competitive industry. As we look to the future, these trends offer valuable insights for investors and stakeholders alike.
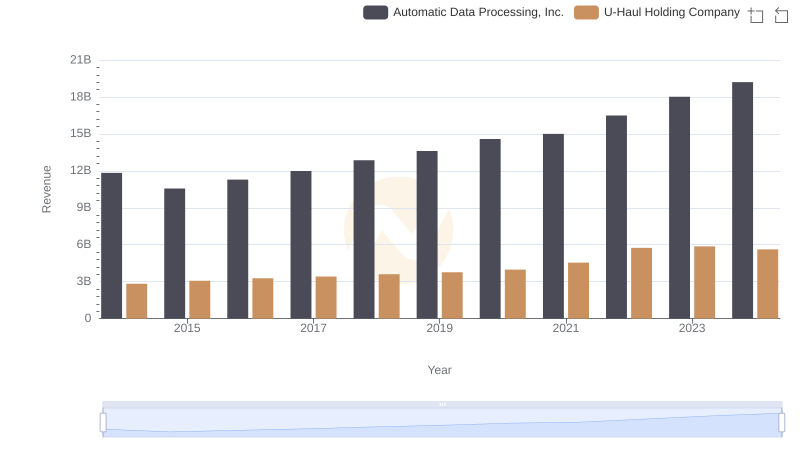
Automatic Data Processing, Inc. or U-Haul Holding Company: Who Leads in Yearly Revenue?
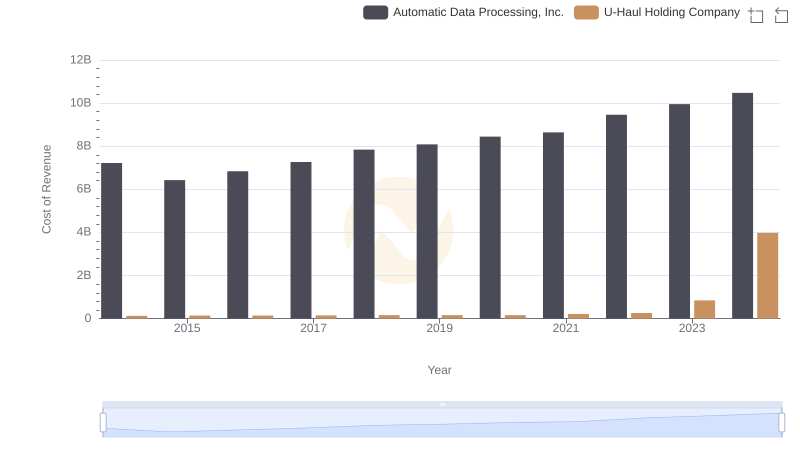
Cost of Revenue Trends: Automatic Data Processing, Inc. vs U-Haul Holding Company
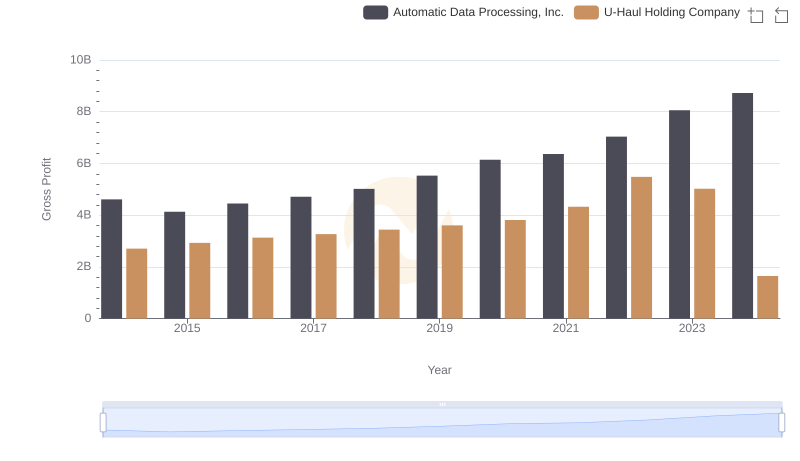
Gross Profit Analysis: Comparing Automatic Data Processing, Inc. and U-Haul Holding Company
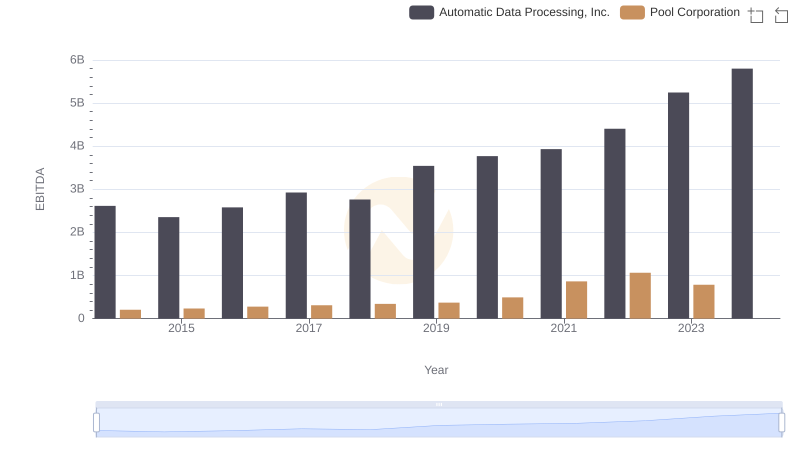
Professional EBITDA Benchmarking: Automatic Data Processing, Inc. vs Pool Corporation
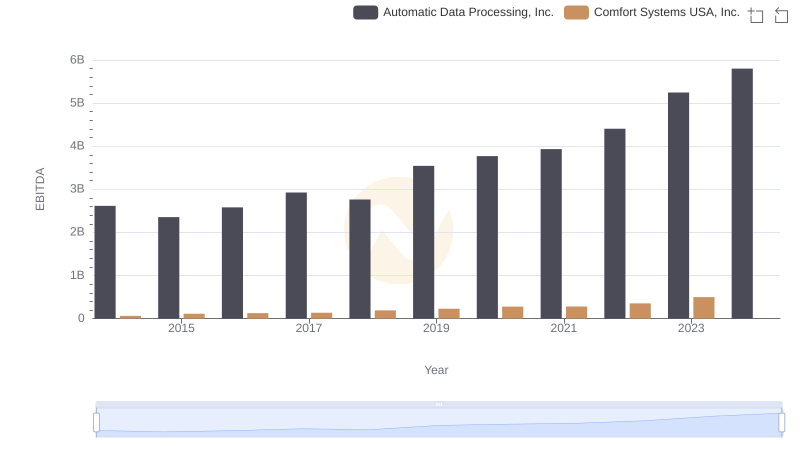
EBITDA Analysis: Evaluating Automatic Data Processing, Inc. Against Comfort Systems USA, Inc.

Operational Costs Compared: SG&A Analysis of Automatic Data Processing, Inc. and U-Haul Holding Company
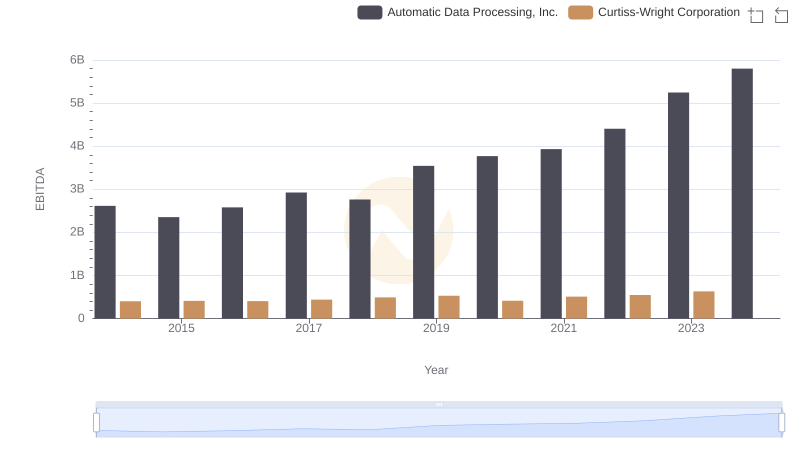
A Side-by-Side Analysis of EBITDA: Automatic Data Processing, Inc. and Curtiss-Wright Corporation

Comprehensive EBITDA Comparison: Automatic Data Processing, Inc. vs Elbit Systems Ltd.

Automatic Data Processing, Inc. vs Nordson Corporation: In-Depth EBITDA Performance Comparison
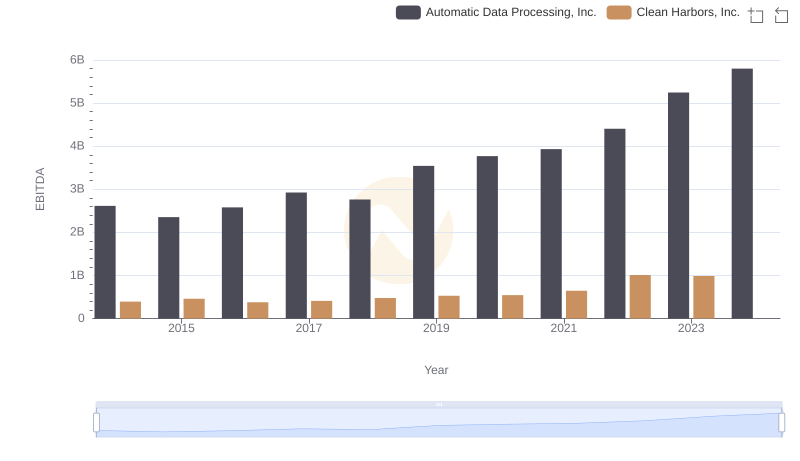
EBITDA Performance Review: Automatic Data Processing, Inc. vs Clean Harbors, Inc.
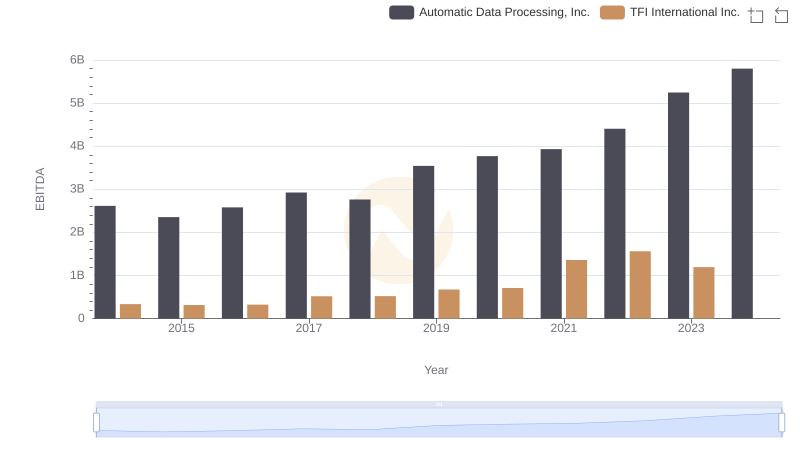
Automatic Data Processing, Inc. vs TFI International Inc.: In-Depth EBITDA Performance Comparison