| __timestamp | Parker-Hannifin Corporation | Verisk Analytics, Inc. |
|---|---|---|
| Wednesday, January 1, 2014 | 1633992000 | 227306000 |
| Thursday, January 1, 2015 | 1544746000 | 312690000 |
| Friday, January 1, 2016 | 1359360000 | 301600000 |
| Sunday, January 1, 2017 | 1453935000 | 322800000 |
| Monday, January 1, 2018 | 1657152000 | 378700000 |
| Tuesday, January 1, 2019 | 1543939000 | 603500000 |
| Wednesday, January 1, 2020 | 1656553000 | 413900000 |
| Friday, January 1, 2021 | 1527302000 | 422700000 |
| Saturday, January 1, 2022 | 1627116000 | 381500000 |
| Sunday, January 1, 2023 | 3354103000 | 389300000 |
| Monday, January 1, 2024 | 3315177000 |
Infusing magic into the data realm
In the world of corporate finance, Selling, General, and Administrative (SG&A) expenses are a critical measure of operational efficiency. This analysis compares the SG&A trends of Parker-Hannifin Corporation and Verisk Analytics, Inc. over the past decade.
Parker-Hannifin, a leader in motion and control technologies, has seen its SG&A expenses fluctuate over the years. From 2014 to 2023, the company experienced a 105% increase, peaking in 2023 with a significant rise to over $3.3 billion. This surge suggests strategic investments or increased operational costs.
Verisk Analytics, a data analytics powerhouse, maintained a more stable SG&A trajectory. Despite a 165% increase from 2014 to 2019, expenses stabilized around $389 million by 2023. This consistency reflects efficient cost management amidst growth.
The data highlights contrasting strategies: Parker-Hannifin's aggressive expansion versus Verisk's steady efficiency.
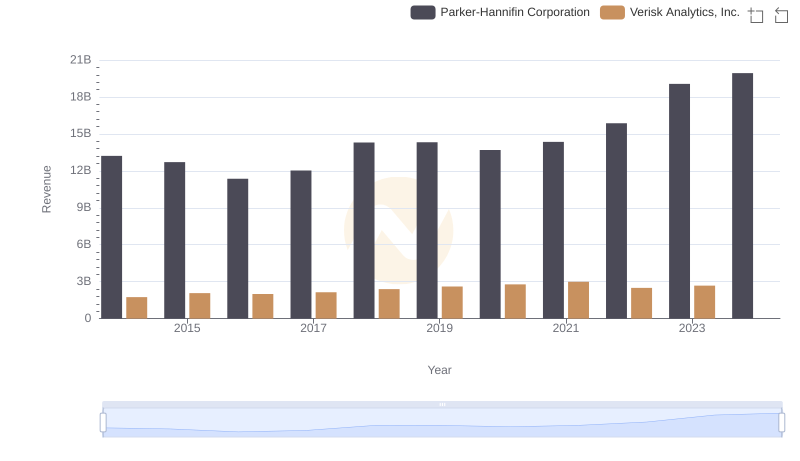
Breaking Down Revenue Trends: Parker-Hannifin Corporation vs Verisk Analytics, Inc.
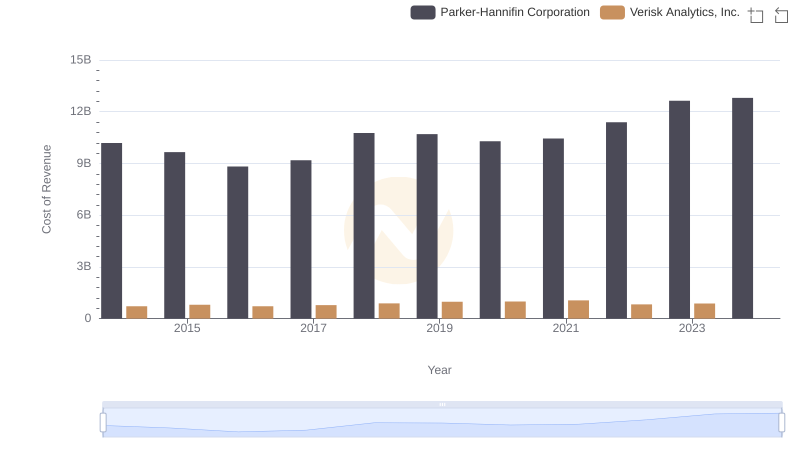
Cost of Revenue Comparison: Parker-Hannifin Corporation vs Verisk Analytics, Inc.

Cost Management Insights: SG&A Expenses for Parker-Hannifin Corporation and Old Dominion Freight Line, Inc.
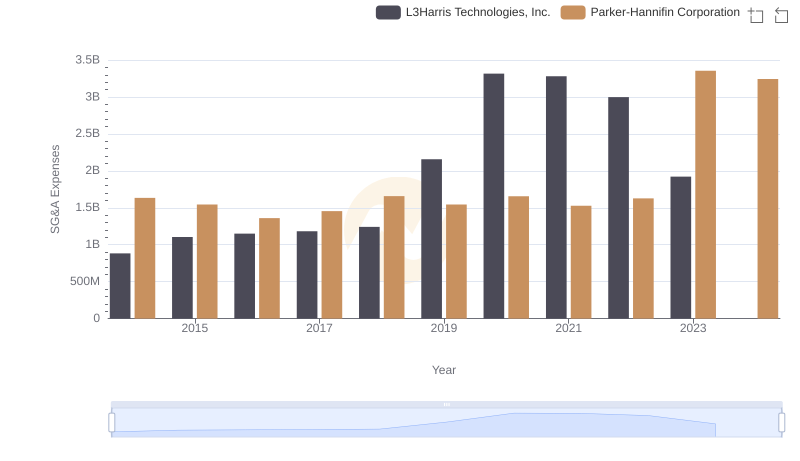
Who Optimizes SG&A Costs Better? Parker-Hannifin Corporation or L3Harris Technologies, Inc.
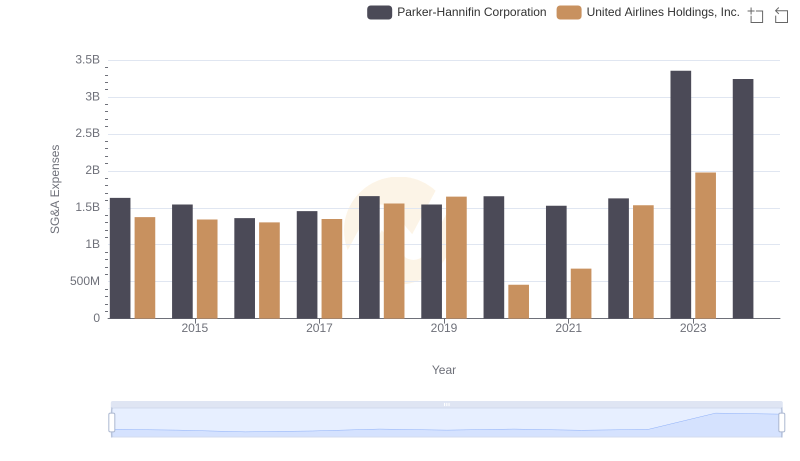
Selling, General, and Administrative Costs: Parker-Hannifin Corporation vs United Airlines Holdings, Inc.
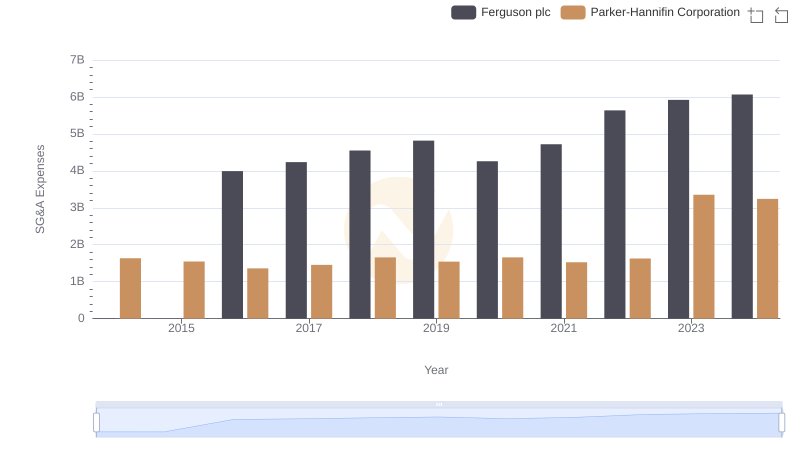
SG&A Efficiency Analysis: Comparing Parker-Hannifin Corporation and Ferguson plc
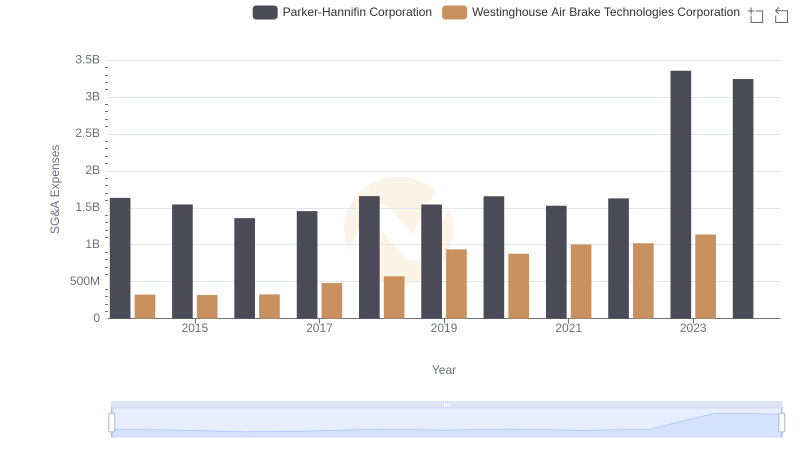
Cost Management Insights: SG&A Expenses for Parker-Hannifin Corporation and Westinghouse Air Brake Technologies Corporation
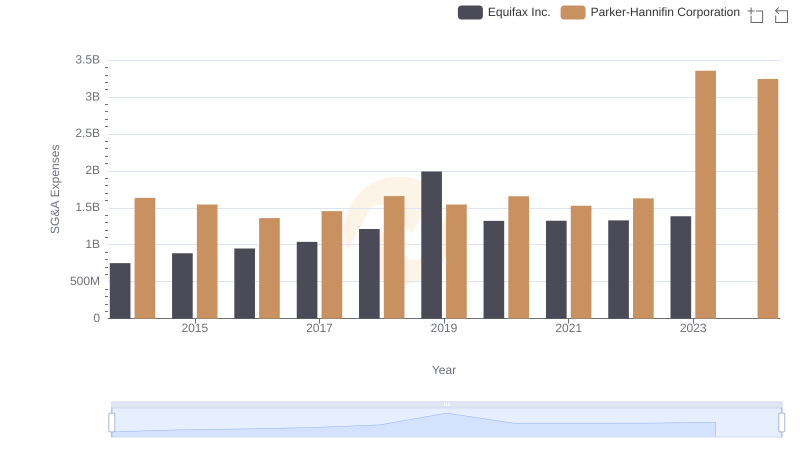
Cost Management Insights: SG&A Expenses for Parker-Hannifin Corporation and Equifax Inc.
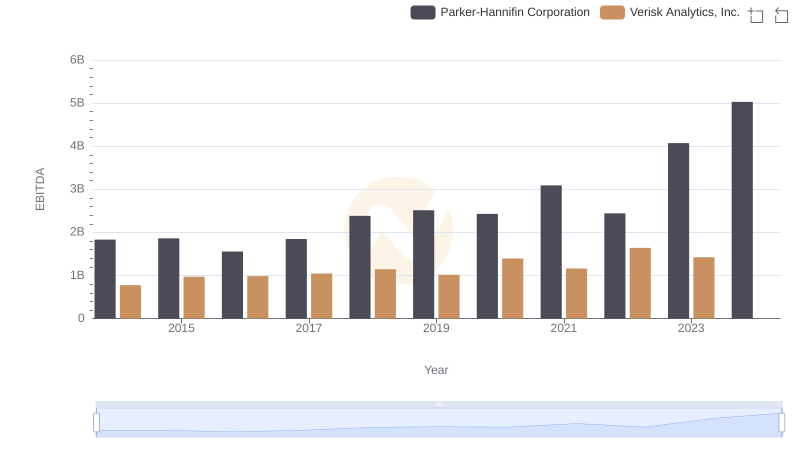
Parker-Hannifin Corporation vs Verisk Analytics, Inc.: In-Depth EBITDA Performance Comparison