| __timestamp | Parker-Hannifin Corporation | Verisk Analytics, Inc. |
|---|---|---|
| Wednesday, January 1, 2014 | 10188227000 | 716598000 |
| Thursday, January 1, 2015 | 9655245000 | 803274000 |
| Friday, January 1, 2016 | 8823384000 | 714400000 |
| Sunday, January 1, 2017 | 9188962000 | 783800000 |
| Monday, January 1, 2018 | 10762841000 | 886200000 |
| Tuesday, January 1, 2019 | 10703484000 | 976800000 |
| Wednesday, January 1, 2020 | 10286518000 | 993900000 |
| Friday, January 1, 2021 | 10449680000 | 1057800000 |
| Saturday, January 1, 2022 | 11387267000 | 824600000 |
| Sunday, January 1, 2023 | 12635892000 | 876500000 |
| Monday, January 1, 2024 | 12801816000 |
Unveiling the hidden dimensions of data
In the world of industrial and analytics sectors, Parker-Hannifin Corporation and Verisk Analytics, Inc. stand as titans. Over the past decade, Parker-Hannifin has consistently outpaced Verisk in terms of cost of revenue, reflecting its expansive operations in motion and control technologies. From 2014 to 2023, Parker-Hannifin's cost of revenue surged by approximately 25%, peaking in 2023. In contrast, Verisk Analytics, a leader in data analytics, maintained a more stable cost structure, with a modest increase of around 18% over the same period. Notably, Parker-Hannifin's cost of revenue in 2023 was nearly 15 times that of Verisk, highlighting the scale of its operations. However, data for 2024 is incomplete, leaving room for speculation on future trends. This comparison underscores the diverse strategies and market dynamics of these industry leaders.
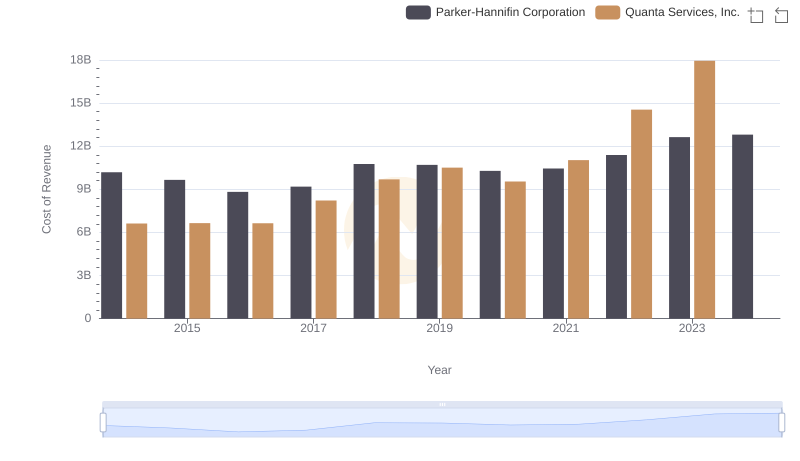
Parker-Hannifin Corporation vs Quanta Services, Inc.: Efficiency in Cost of Revenue Explored
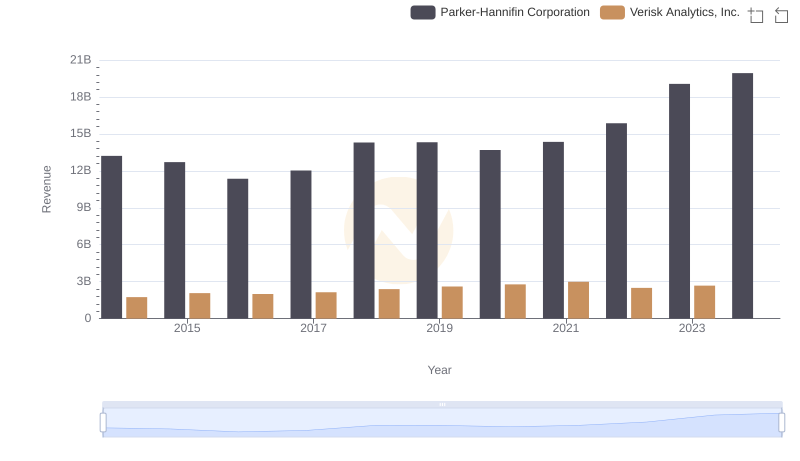
Breaking Down Revenue Trends: Parker-Hannifin Corporation vs Verisk Analytics, Inc.
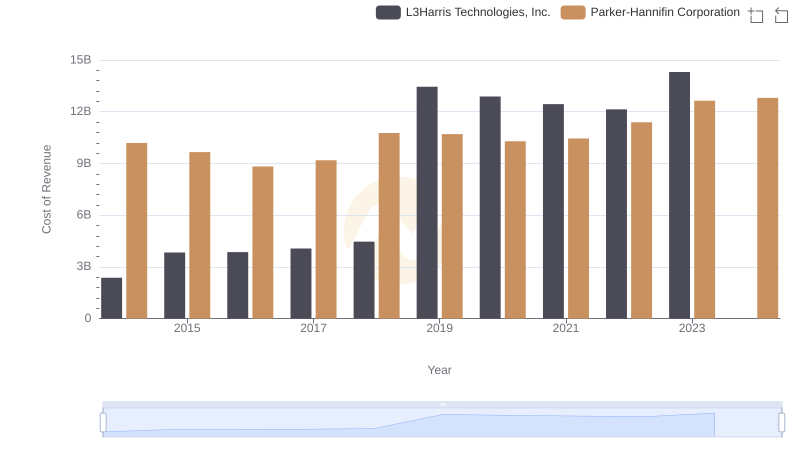
Cost of Revenue Comparison: Parker-Hannifin Corporation vs L3Harris Technologies, Inc.
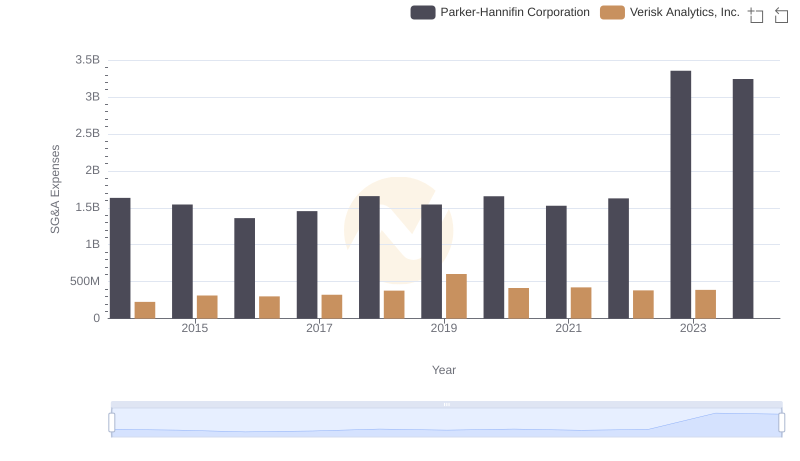
Comparing SG&A Expenses: Parker-Hannifin Corporation vs Verisk Analytics, Inc. Trends and Insights
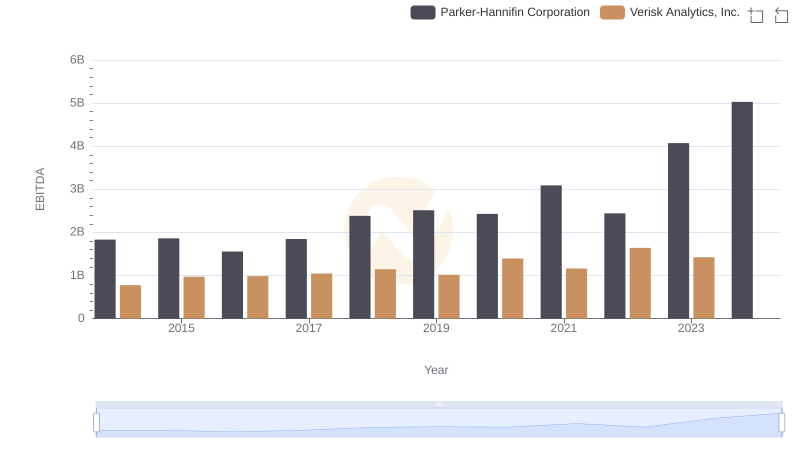
Parker-Hannifin Corporation vs Verisk Analytics, Inc.: In-Depth EBITDA Performance Comparison