| __timestamp | Parker-Hannifin Corporation | Verisk Analytics, Inc. |
|---|---|---|
| Wednesday, January 1, 2014 | 13215971000 | 1746726000 |
| Thursday, January 1, 2015 | 12711744000 | 2068010000 |
| Friday, January 1, 2016 | 11360753000 | 1995200000 |
| Sunday, January 1, 2017 | 12029312000 | 2145200000 |
| Monday, January 1, 2018 | 14302392000 | 2395100000 |
| Tuesday, January 1, 2019 | 14320324000 | 2607100000 |
| Wednesday, January 1, 2020 | 13695520000 | 2784600000 |
| Friday, January 1, 2021 | 14347640000 | 2998600000 |
| Saturday, January 1, 2022 | 15861608000 | 2497000000 |
| Sunday, January 1, 2023 | 19065194000 | 2681400000 |
| Monday, January 1, 2024 | 19929606000 |
Unlocking the unknown
In the ever-evolving landscape of industrial and analytics sectors, Parker-Hannifin Corporation and Verisk Analytics, Inc. have showcased intriguing revenue trajectories over the past decade. Parker-Hannifin, a leader in motion and control technologies, has seen its revenue grow by approximately 51% from 2014 to 2023, peaking at nearly $20 billion in 2023. This growth reflects its strategic expansions and innovations in engineering solutions.
On the other hand, Verisk Analytics, a prominent player in data analytics, experienced a steady revenue increase of about 54% from 2014 to 2022, reaching close to $3 billion. However, data for 2024 remains elusive, leaving room for speculation on its future performance.
These trends highlight the dynamic nature of these industries, where technological advancements and market demands drive financial outcomes. As we look to the future, the question remains: how will these companies adapt to the ever-changing economic landscape?
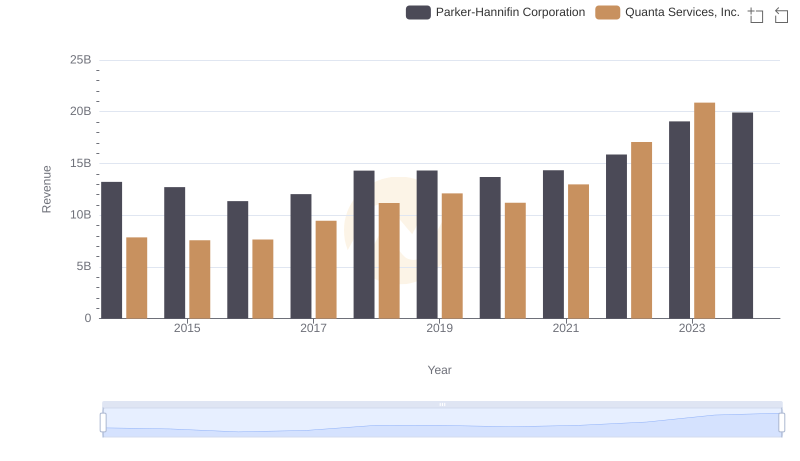
Comparing Revenue Performance: Parker-Hannifin Corporation or Quanta Services, Inc.?

Comparing Revenue Performance: Parker-Hannifin Corporation or L3Harris Technologies, Inc.?
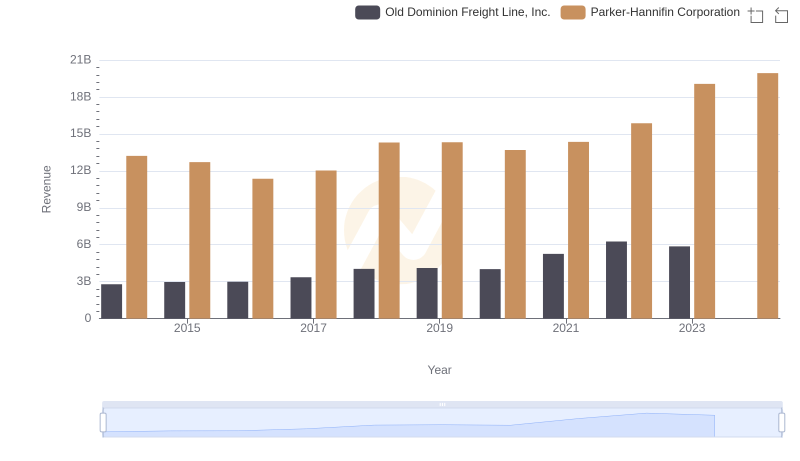
Breaking Down Revenue Trends: Parker-Hannifin Corporation vs Old Dominion Freight Line, Inc.
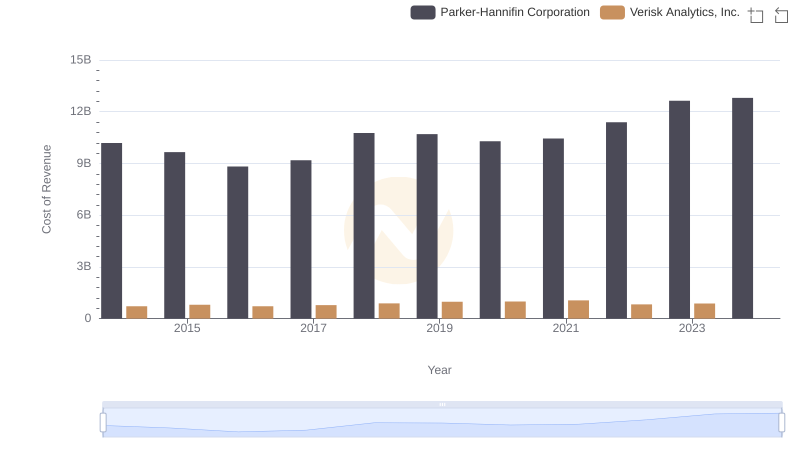
Cost of Revenue Comparison: Parker-Hannifin Corporation vs Verisk Analytics, Inc.
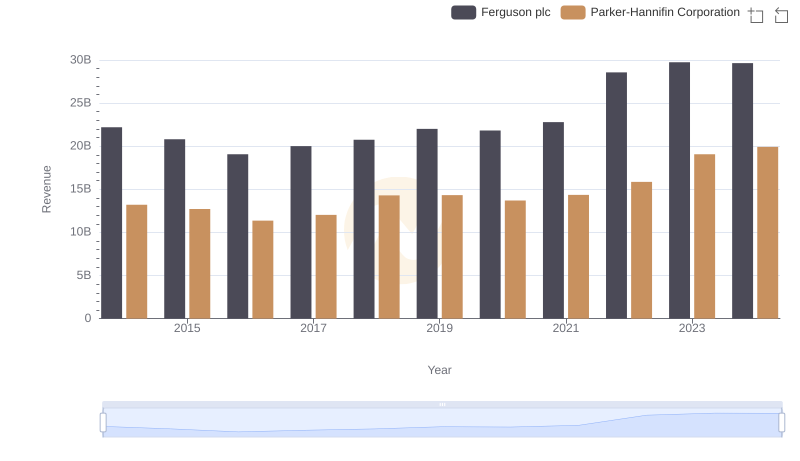
Parker-Hannifin Corporation vs Ferguson plc: Annual Revenue Growth Compared
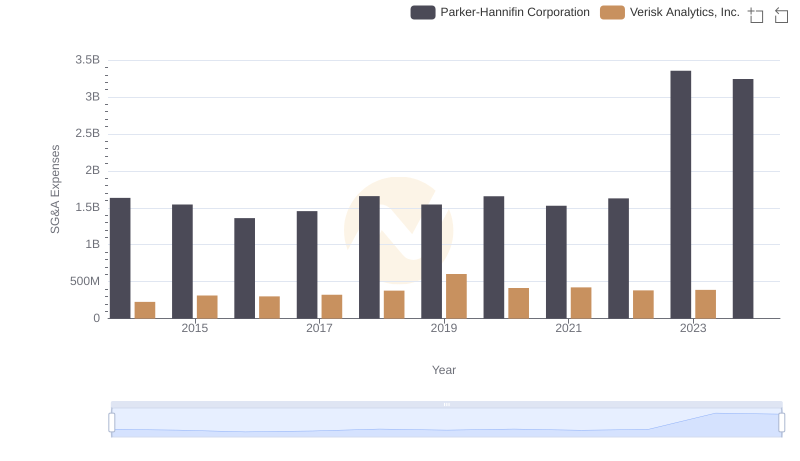
Comparing SG&A Expenses: Parker-Hannifin Corporation vs Verisk Analytics, Inc. Trends and Insights
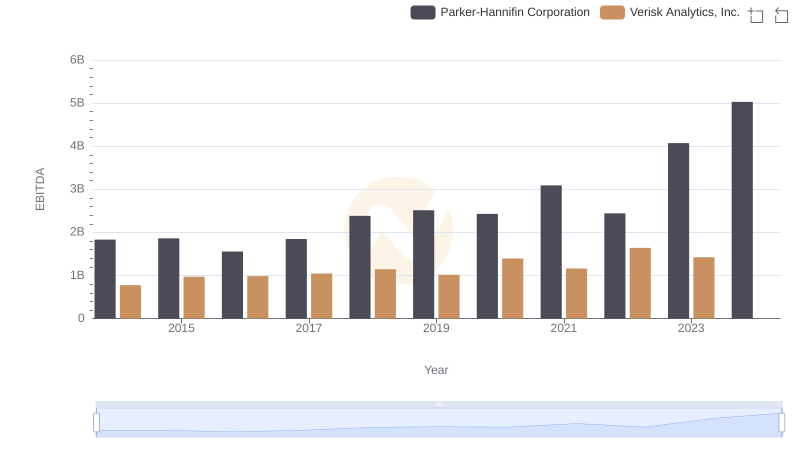
Parker-Hannifin Corporation vs Verisk Analytics, Inc.: In-Depth EBITDA Performance Comparison