| __timestamp | Infosys Limited | Nutanix, Inc. |
|---|---|---|
| Wednesday, January 1, 2014 | 1079000000 | 106497000 |
| Thursday, January 1, 2015 | 1176000000 | 185728000 |
| Friday, January 1, 2016 | 1020000000 | 322758000 |
| Sunday, January 1, 2017 | 1279000000 | 577870000 |
| Monday, January 1, 2018 | 1220000000 | 736058000 |
| Tuesday, January 1, 2019 | 1504000000 | 1029337000 |
| Wednesday, January 1, 2020 | 1223000000 | 1295936000 |
| Friday, January 1, 2021 | 1391000000 | 1206290000 |
| Saturday, January 1, 2022 | 1678000000 | 1145122000 |
| Sunday, January 1, 2023 | 1632000000 | 1156897000 |
| Monday, January 1, 2024 | 1178149000 |
Unleashing insights
In the ever-evolving landscape of global business, understanding the financial strategies of leading companies is crucial. This analysis delves into the Selling, General, and Administrative (SG&A) expenses of two tech giants: Infosys Limited and Nutanix, Inc., from 2014 to 2023.
Infosys Limited, a stalwart in the IT services sector, has shown a steady increase in SG&A expenses, peaking in 2022 with a 55% rise from 2014. This trend reflects its strategic investments in global expansion and innovation. In contrast, Nutanix, Inc., a leader in cloud computing, experienced a dramatic surge in SG&A expenses, growing over tenfold from 2014 to 2020, highlighting its aggressive market penetration strategy.
While Infosys maintained a consistent upward trajectory, Nutanix's expenses fluctuated, indicating a dynamic approach to scaling operations. Notably, 2024 data for Infosys is missing, suggesting a potential shift or anomaly in reporting.
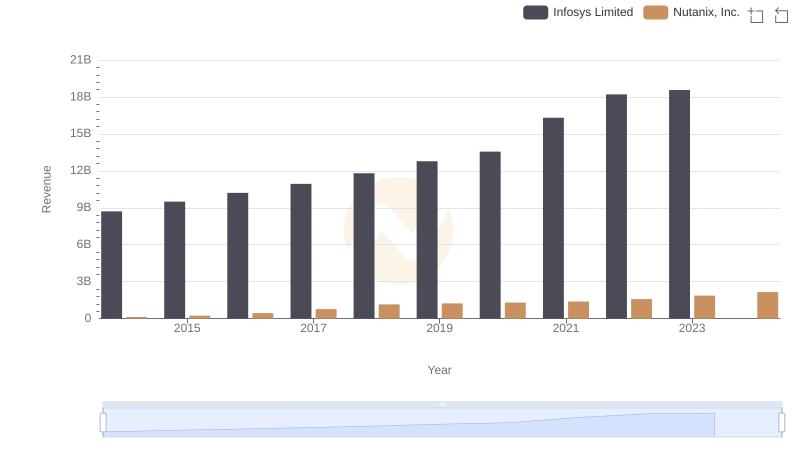
Revenue Insights: Infosys Limited and Nutanix, Inc. Performance Compared

Breaking Down SG&A Expenses: Infosys Limited vs Teradyne, Inc.
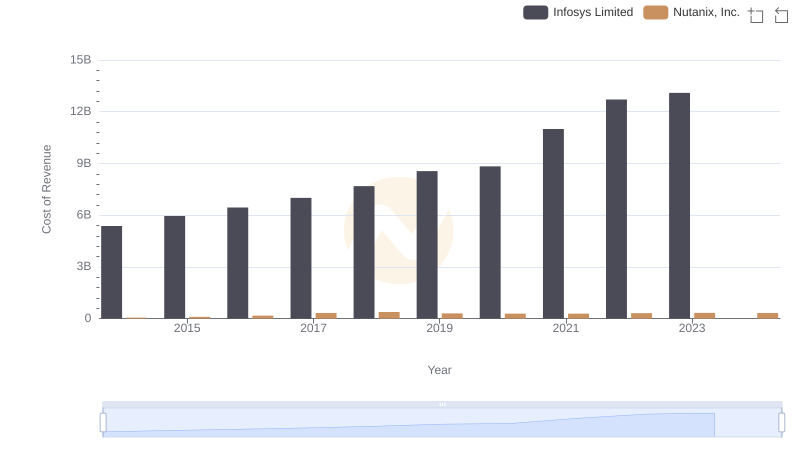
Infosys Limited vs Nutanix, Inc.: Efficiency in Cost of Revenue Explored
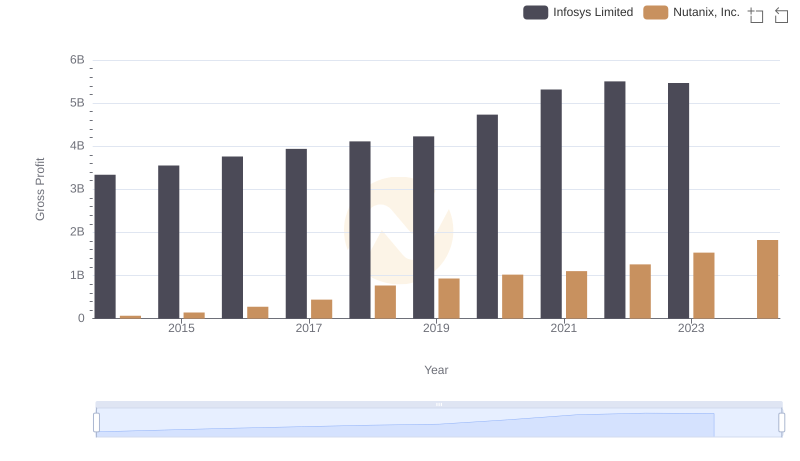
Key Insights on Gross Profit: Infosys Limited vs Nutanix, Inc.
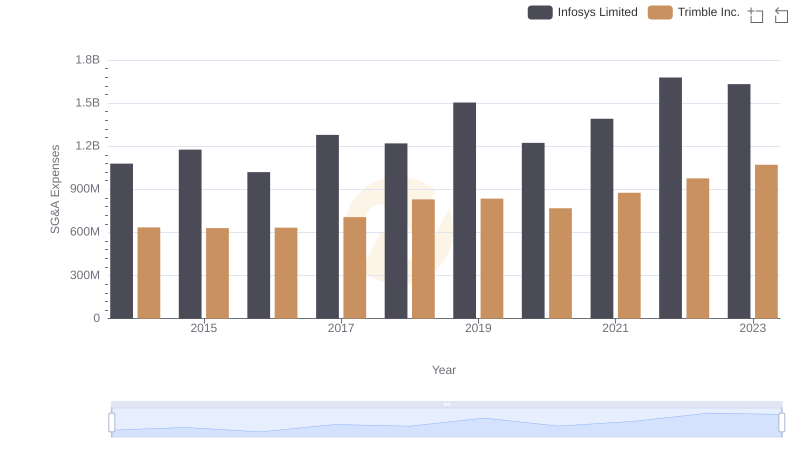
SG&A Efficiency Analysis: Comparing Infosys Limited and Trimble Inc.
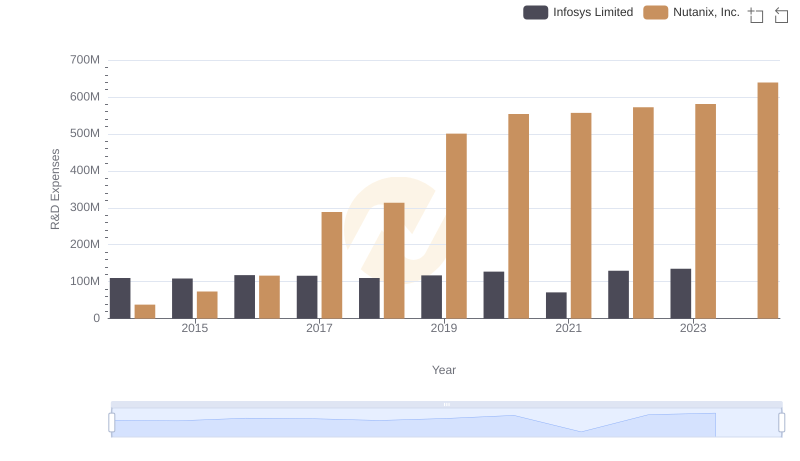
Analyzing R&D Budgets: Infosys Limited vs Nutanix, Inc.
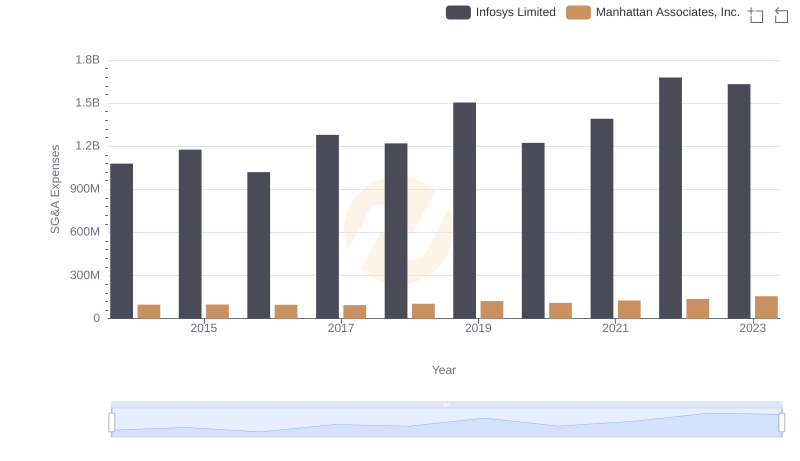
Who Optimizes SG&A Costs Better? Infosys Limited or Manhattan Associates, Inc.
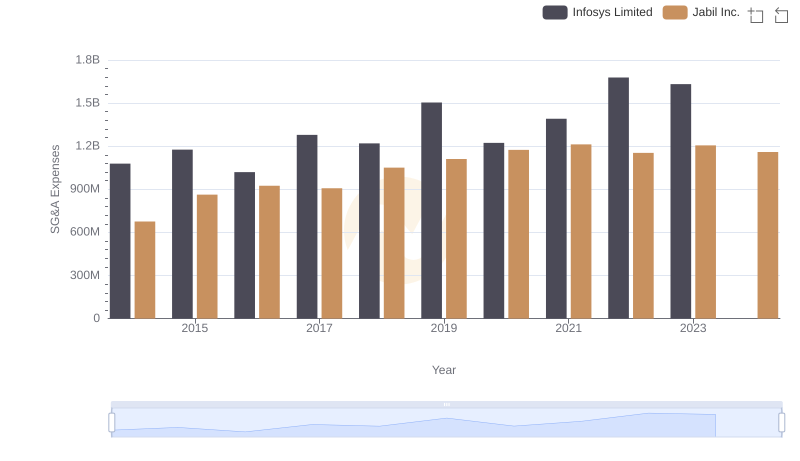
Infosys Limited and Jabil Inc.: SG&A Spending Patterns Compared
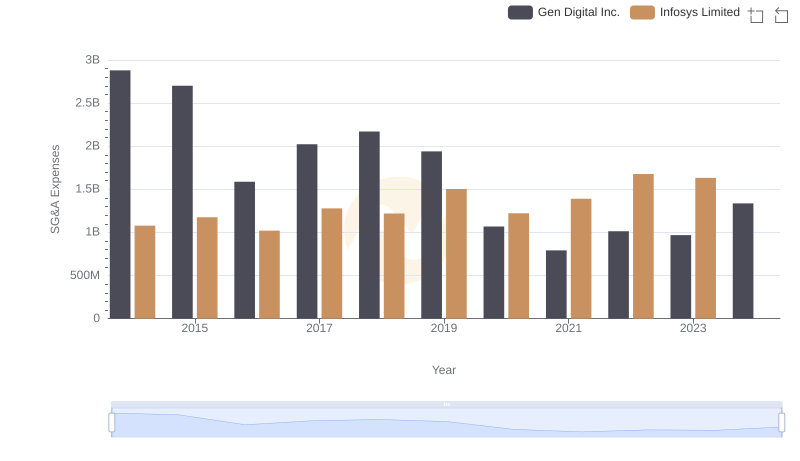
Who Optimizes SG&A Costs Better? Infosys Limited or Gen Digital Inc.
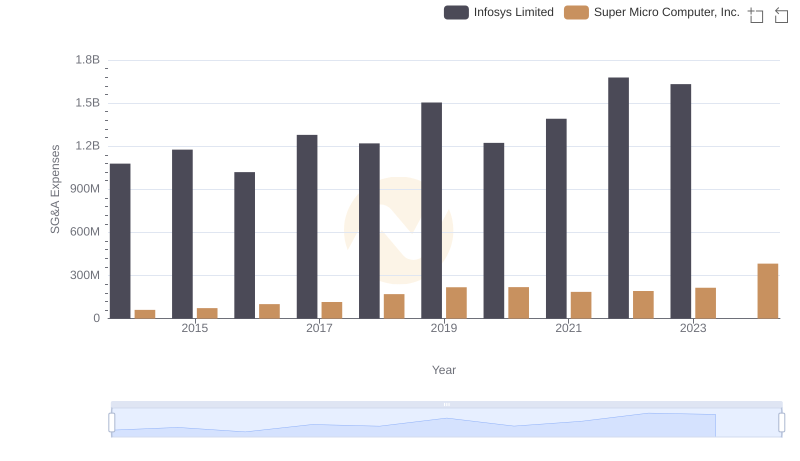
Breaking Down SG&A Expenses: Infosys Limited vs Super Micro Computer, Inc.
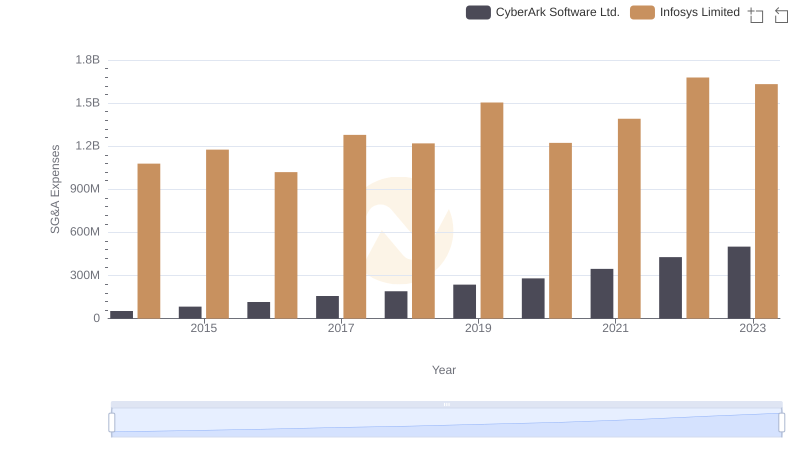
Breaking Down SG&A Expenses: Infosys Limited vs CyberArk Software Ltd.
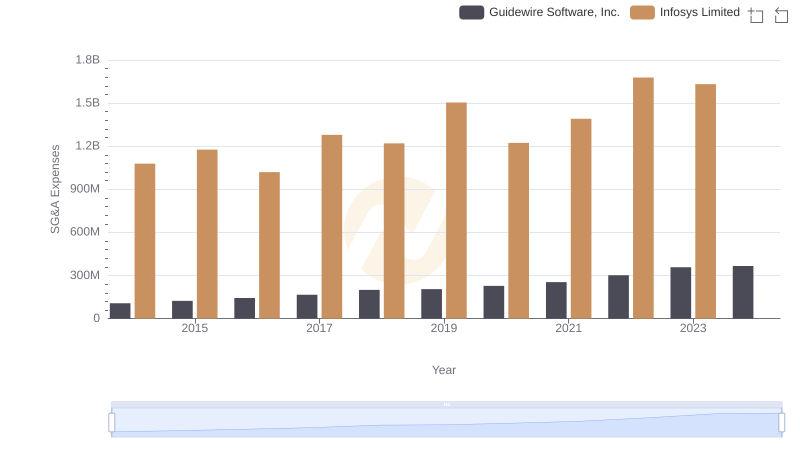
Selling, General, and Administrative Costs: Infosys Limited vs Guidewire Software, Inc.