| __timestamp | Infosys Limited | Jabil Inc. |
|---|---|---|
| Wednesday, January 1, 2014 | 1079000000 | 675730000 |
| Thursday, January 1, 2015 | 1176000000 | 862647000 |
| Friday, January 1, 2016 | 1020000000 | 924427000 |
| Sunday, January 1, 2017 | 1279000000 | 907702000 |
| Monday, January 1, 2018 | 1220000000 | 1050716000 |
| Tuesday, January 1, 2019 | 1504000000 | 1111347000 |
| Wednesday, January 1, 2020 | 1223000000 | 1174694000 |
| Friday, January 1, 2021 | 1391000000 | 1213000000 |
| Saturday, January 1, 2022 | 1678000000 | 1154000000 |
| Sunday, January 1, 2023 | 1632000000 | 1206000000 |
| Monday, January 1, 2024 | 1160000000 |
Unlocking the unknown
In the ever-evolving landscape of global business, understanding the financial strategies of industry leaders is crucial. Infosys Limited and Jabil Inc., two titans in their respective fields, have shown distinct patterns in their Selling, General, and Administrative (SG&A) expenses over the past decade. From 2014 to 2023, Infosys consistently increased its SG&A spending, peaking in 2022 with a 55% rise from 2014. Meanwhile, Jabil Inc. demonstrated a steadier growth, with a notable 79% increase in 2023 compared to 2014. This divergence highlights differing strategic priorities: Infosys's aggressive expansion and Jabil's steady scaling. Interestingly, 2024 data for Infosys is missing, leaving room for speculation on its future trajectory. As businesses navigate post-pandemic realities, these spending patterns offer insights into their adaptive strategies and market positioning.
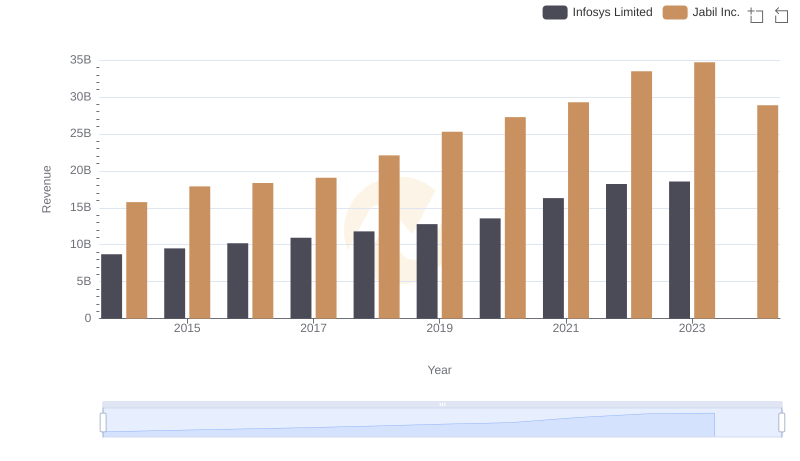
Infosys Limited and Jabil Inc.: A Comprehensive Revenue Analysis
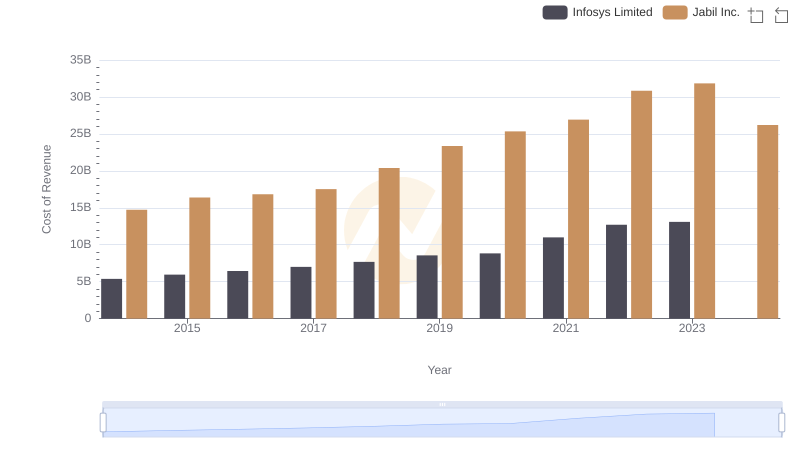
Cost of Revenue: Key Insights for Infosys Limited and Jabil Inc.
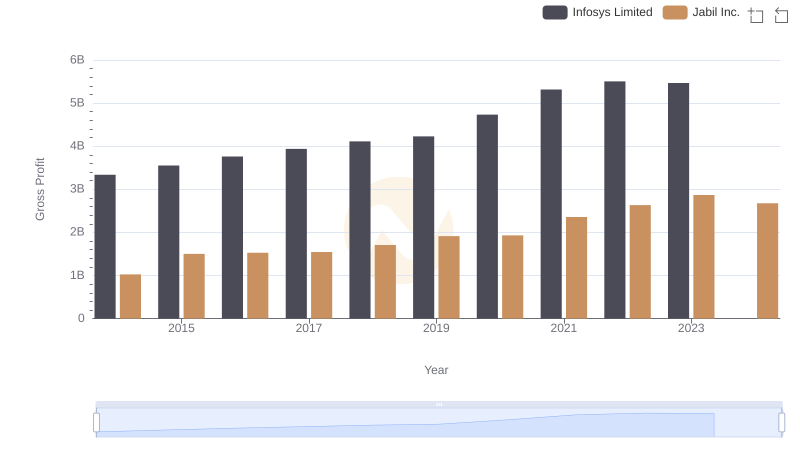
Gross Profit Comparison: Infosys Limited and Jabil Inc. Trends
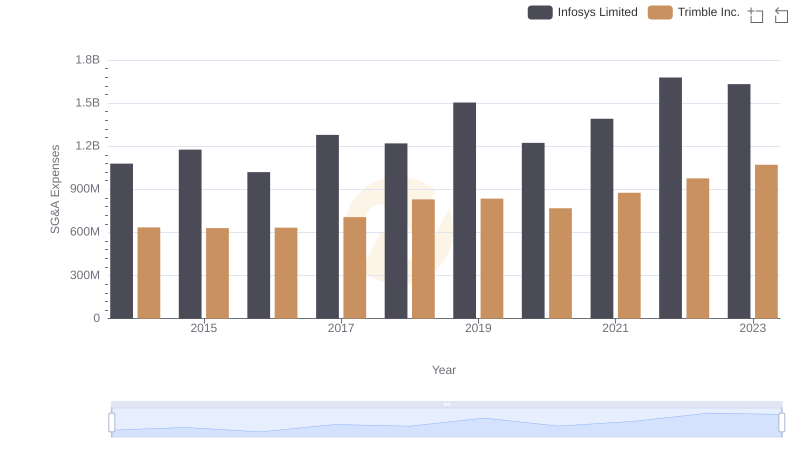
SG&A Efficiency Analysis: Comparing Infosys Limited and Trimble Inc.
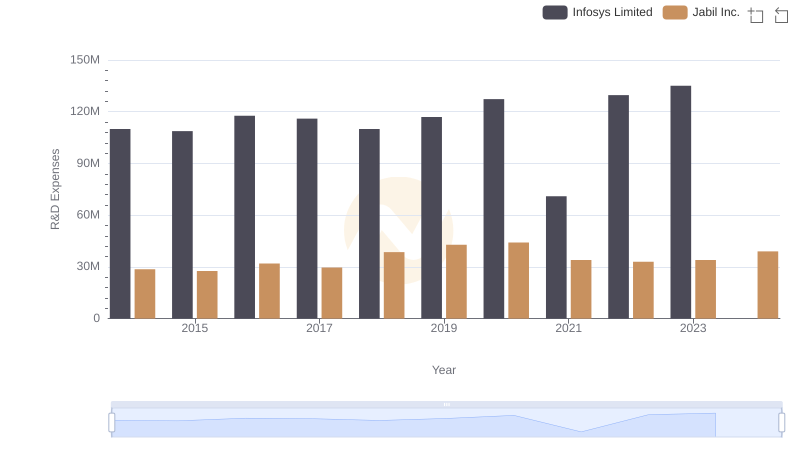
R&D Spending Showdown: Infosys Limited vs Jabil Inc.
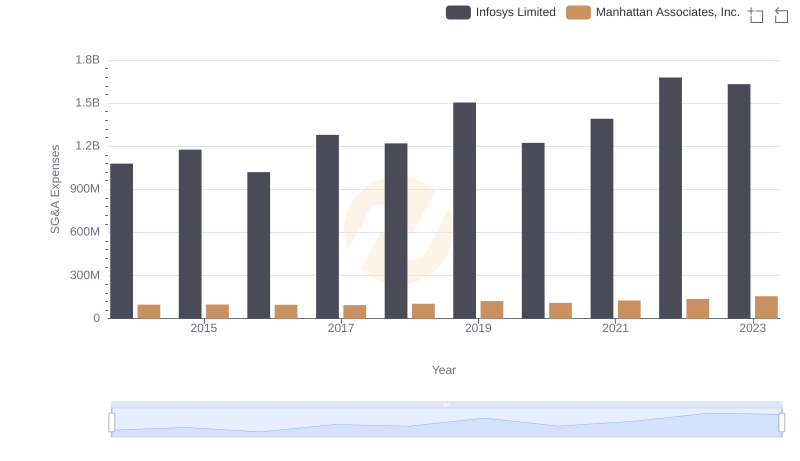
Who Optimizes SG&A Costs Better? Infosys Limited or Manhattan Associates, Inc.
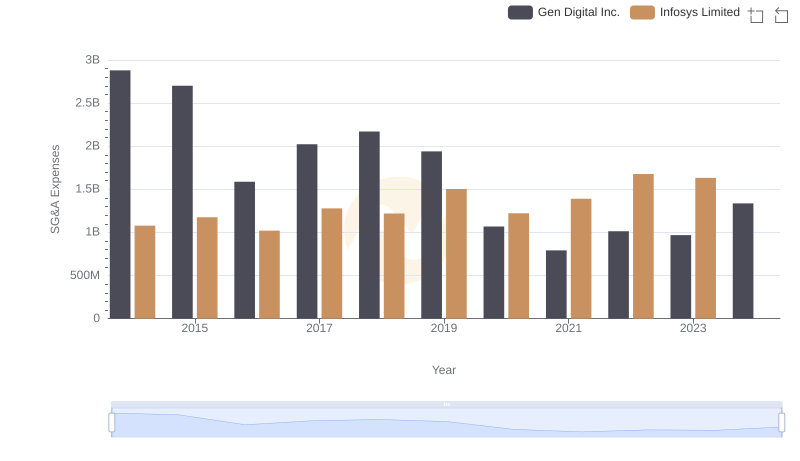
Who Optimizes SG&A Costs Better? Infosys Limited or Gen Digital Inc.
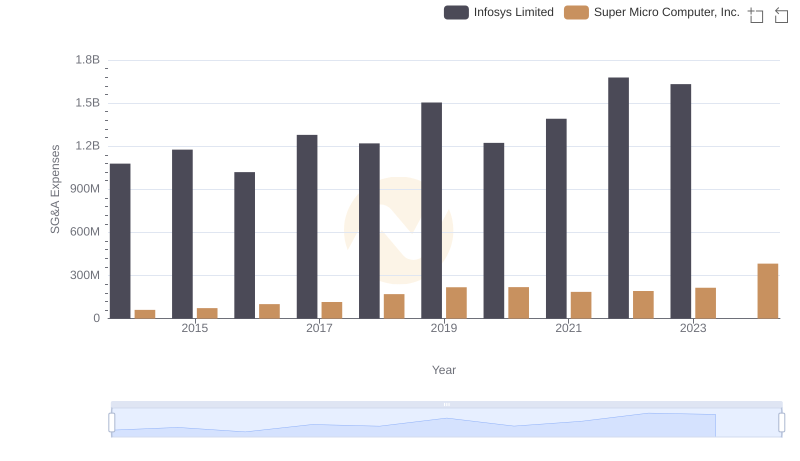
Breaking Down SG&A Expenses: Infosys Limited vs Super Micro Computer, Inc.
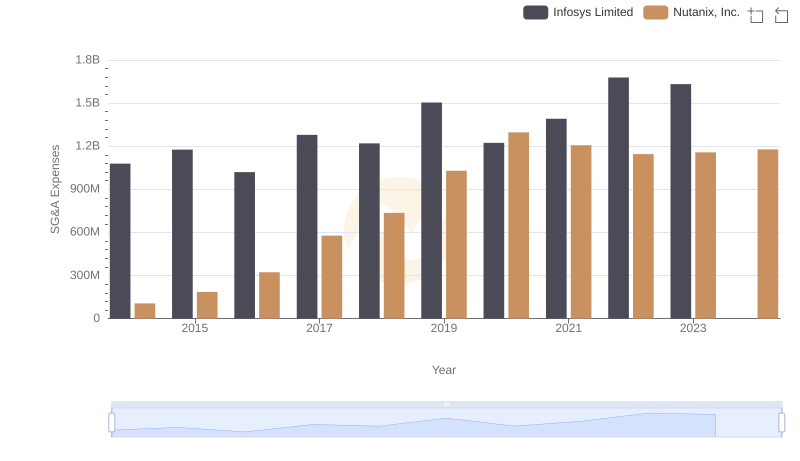
Comparing SG&A Expenses: Infosys Limited vs Nutanix, Inc. Trends and Insights
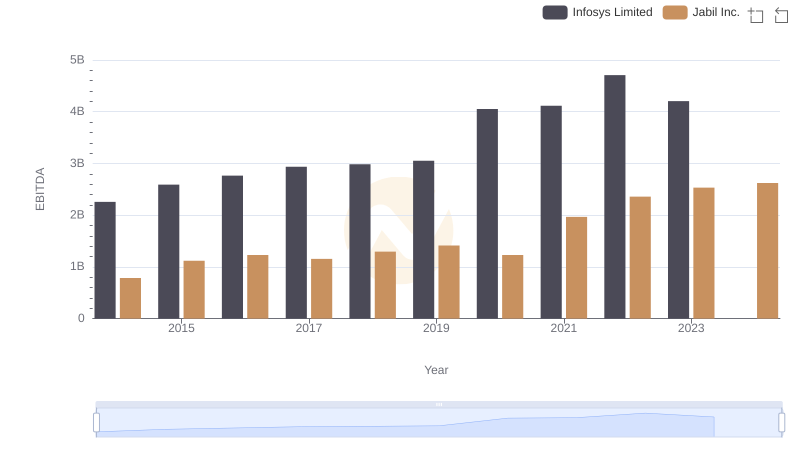
A Professional Review of EBITDA: Infosys Limited Compared to Jabil Inc.
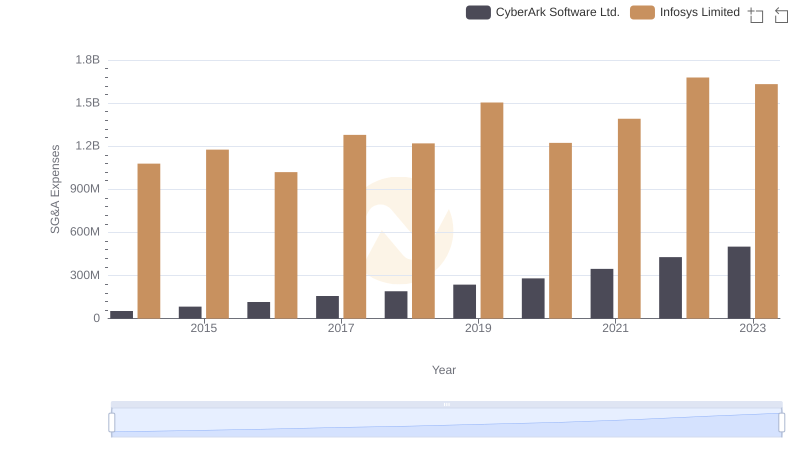
Breaking Down SG&A Expenses: Infosys Limited vs CyberArk Software Ltd.
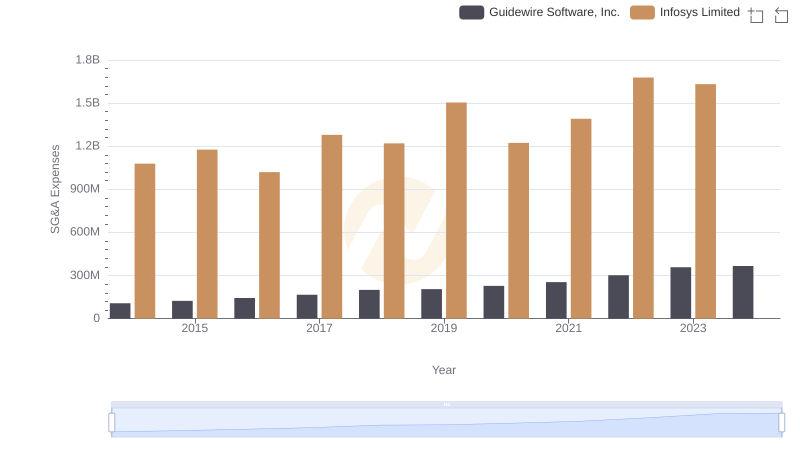
Selling, General, and Administrative Costs: Infosys Limited vs Guidewire Software, Inc.