| __timestamp | Infosys Limited | Nutanix, Inc. |
|---|---|---|
| Wednesday, January 1, 2014 | 5374000000 | 60912000 |
| Thursday, January 1, 2015 | 5950000000 | 100959000 |
| Friday, January 1, 2016 | 6446000000 | 170787000 |
| Sunday, January 1, 2017 | 7001000000 | 327331000 |
| Monday, January 1, 2018 | 7687000000 | 386030000 |
| Tuesday, January 1, 2019 | 8552000000 | 304128000 |
| Wednesday, January 1, 2020 | 8828000000 | 286689000 |
| Friday, January 1, 2021 | 10996000000 | 291906000 |
| Saturday, January 1, 2022 | 12709000000 | 321156000 |
| Sunday, January 1, 2023 | 13096000000 | 332187000 |
| Monday, January 1, 2024 | 324112000 |
Unleashing insights
In the ever-evolving landscape of technology, cost efficiency remains a pivotal factor for success. This analysis delves into the cost of revenue trends for Infosys Limited and Nutanix, Inc. from 2014 to 2023. Over this decade, Infosys has demonstrated a robust growth trajectory, with its cost of revenue increasing by approximately 144%, from $5.37 billion in 2014 to $13.1 billion in 2023. In contrast, Nutanix, Inc. has shown a more modest increase of around 445%, starting at $60.9 million in 2014 and reaching $332 million in 2023.
While Infosys's cost of revenue is significantly higher, reflecting its larger scale, Nutanix's rapid growth rate highlights its dynamic expansion in the tech sector. Notably, the data for 2024 is incomplete, suggesting a need for further analysis to understand future trends. This comparison underscores the diverse strategies employed by these tech giants in managing their operational costs.
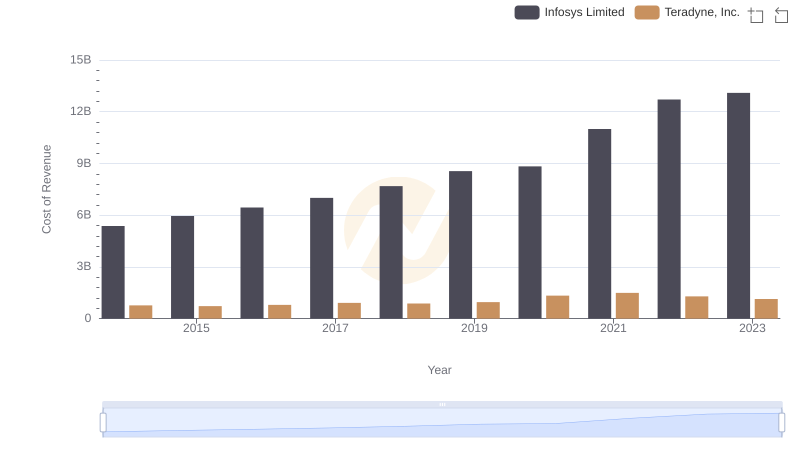
Analyzing Cost of Revenue: Infosys Limited and Teradyne, Inc.

Infosys Limited vs Trimble Inc.: Efficiency in Cost of Revenue Explored
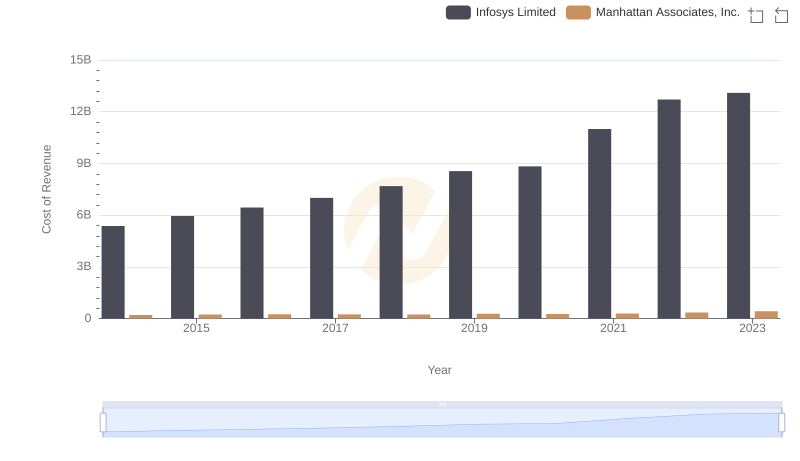
Cost of Revenue Trends: Infosys Limited vs Manhattan Associates, Inc.
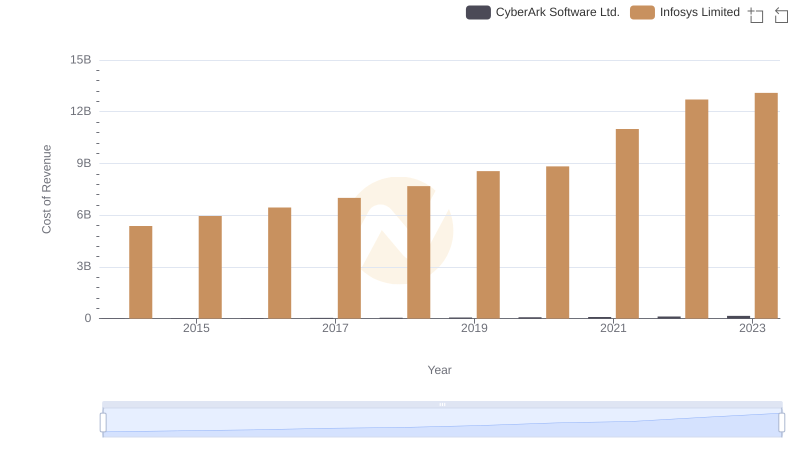
Cost of Revenue: Key Insights for Infosys Limited and CyberArk Software Ltd.
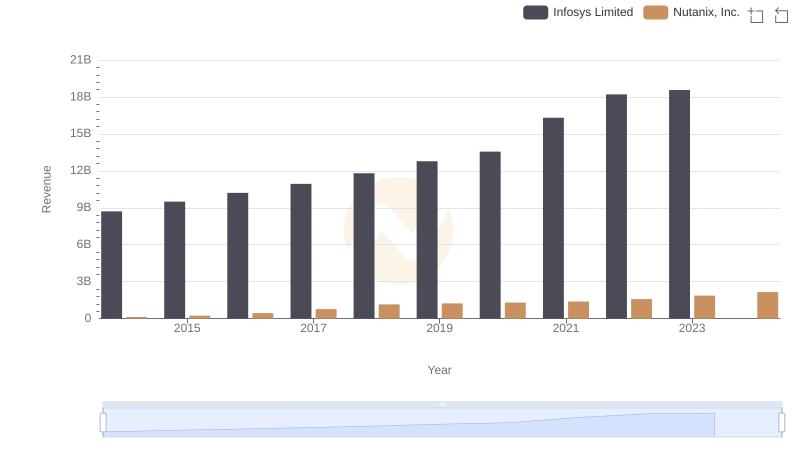
Revenue Insights: Infosys Limited and Nutanix, Inc. Performance Compared
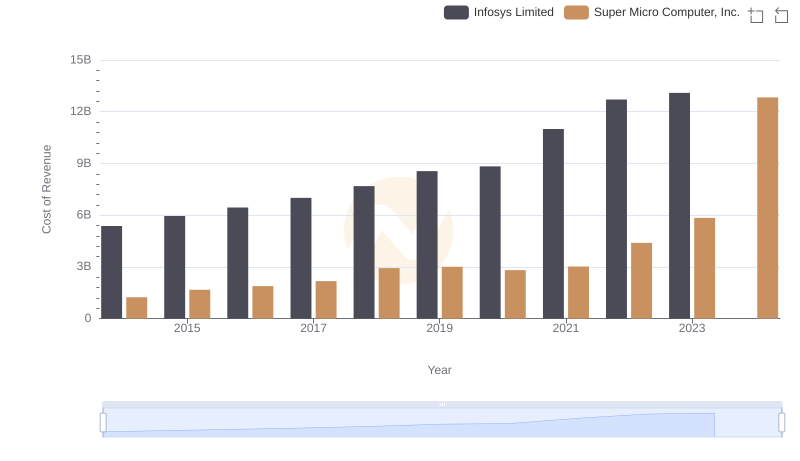
Cost Insights: Breaking Down Infosys Limited and Super Micro Computer, Inc.'s Expenses
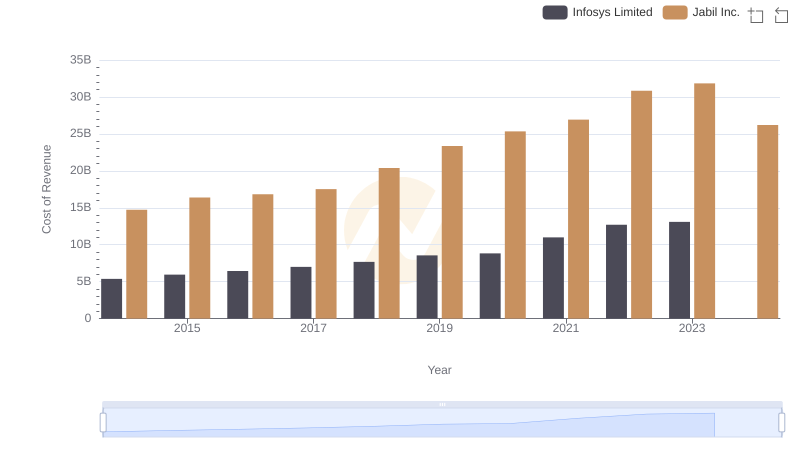
Cost of Revenue: Key Insights for Infosys Limited and Jabil Inc.
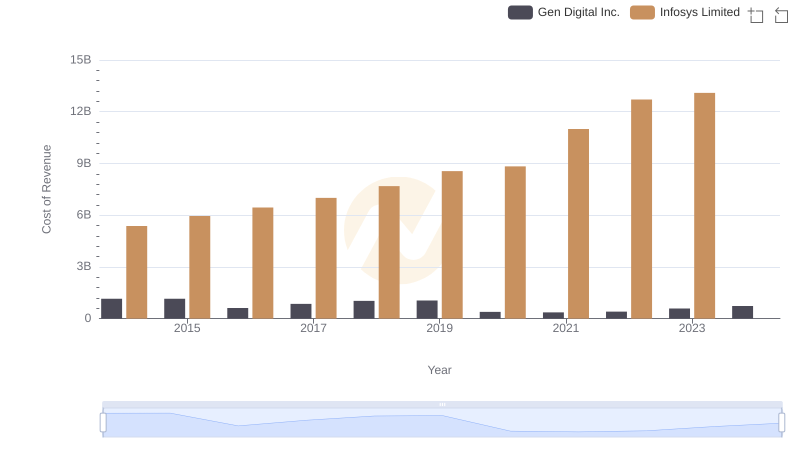
Cost of Revenue Trends: Infosys Limited vs Gen Digital Inc.
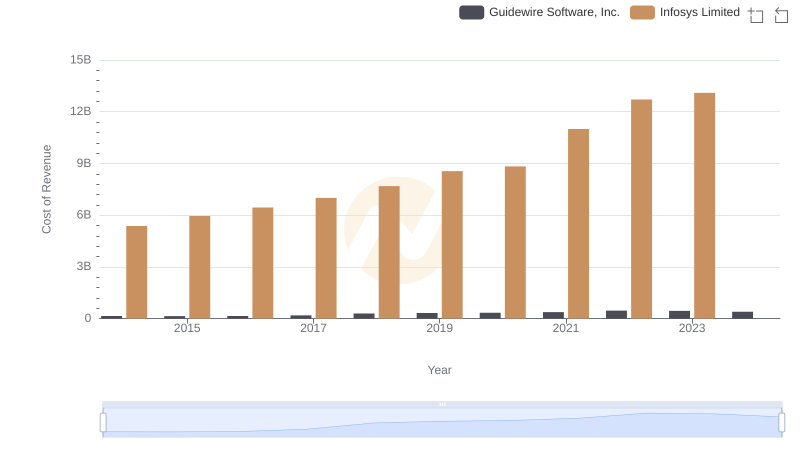
Comparing Cost of Revenue Efficiency: Infosys Limited vs Guidewire Software, Inc.
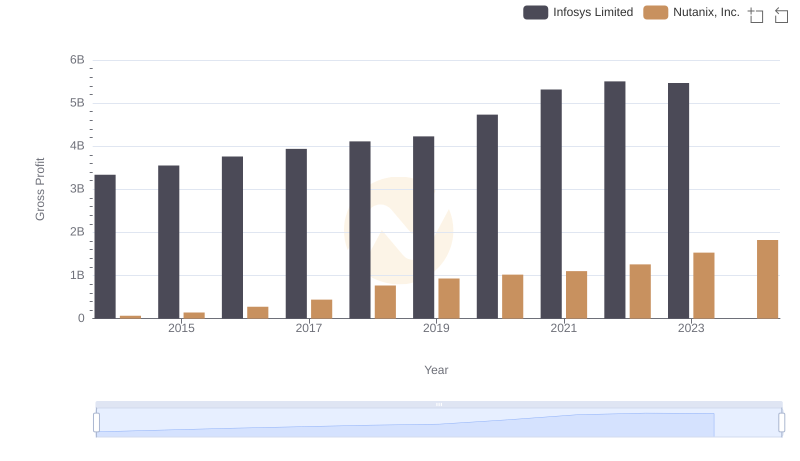
Key Insights on Gross Profit: Infosys Limited vs Nutanix, Inc.
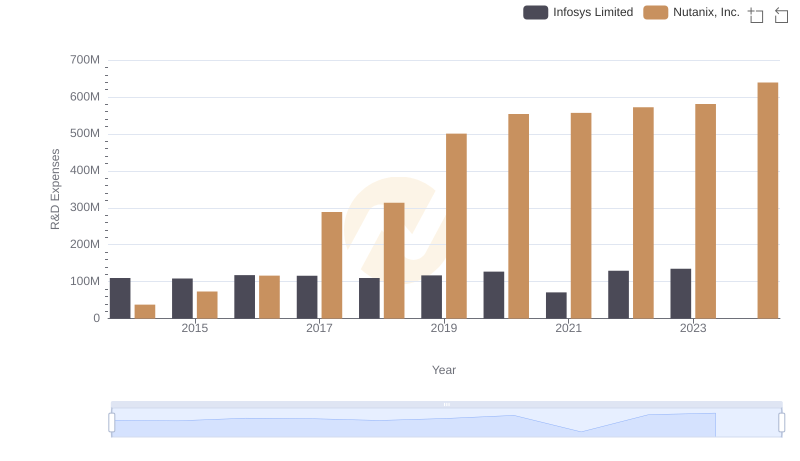
Analyzing R&D Budgets: Infosys Limited vs Nutanix, Inc.
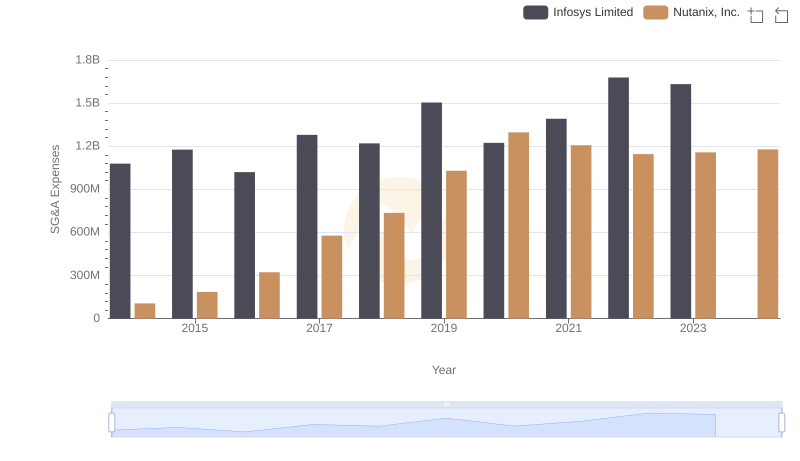
Comparing SG&A Expenses: Infosys Limited vs Nutanix, Inc. Trends and Insights