| __timestamp | CyberArk Software Ltd. | Infosys Limited |
|---|---|---|
| Wednesday, January 1, 2014 | 53438000 | 1079000000 |
| Thursday, January 1, 2015 | 83196000 | 1176000000 |
| Friday, January 1, 2016 | 115892000 | 1020000000 |
| Sunday, January 1, 2017 | 157138000 | 1279000000 |
| Monday, January 1, 2018 | 190334000 | 1220000000 |
| Tuesday, January 1, 2019 | 236476000 | 1504000000 |
| Wednesday, January 1, 2020 | 280428000 | 1223000000 |
| Friday, January 1, 2021 | 345826000 | 1391000000 |
| Saturday, January 1, 2022 | 427793000 | 1678000000 |
| Sunday, January 1, 2023 | 500784000 | 1632000000 |
| Monday, January 1, 2024 | 593210000 |
Infusing magic into the data realm
In the ever-evolving landscape of global technology, understanding the financial strategies of industry leaders is crucial. This analysis delves into the Selling, General, and Administrative (SG&A) expenses of two prominent tech companies: Infosys Limited and CyberArk Software Ltd., from 2014 to 2023.
Infosys, a titan in the IT services sector, consistently allocated a significant portion of its revenue to SG&A expenses, peaking at approximately 1.68 billion USD in 2022. This reflects a strategic investment in maintaining its competitive edge. In contrast, CyberArk, a leader in cybersecurity, exhibited a remarkable growth trajectory in its SG&A expenses, surging by over 800% from 2014 to 2023. This underscores CyberArk's aggressive expansion and market penetration strategies.
This comparative insight not only highlights the differing financial strategies but also offers a glimpse into the broader industry trends shaping the future of technology.
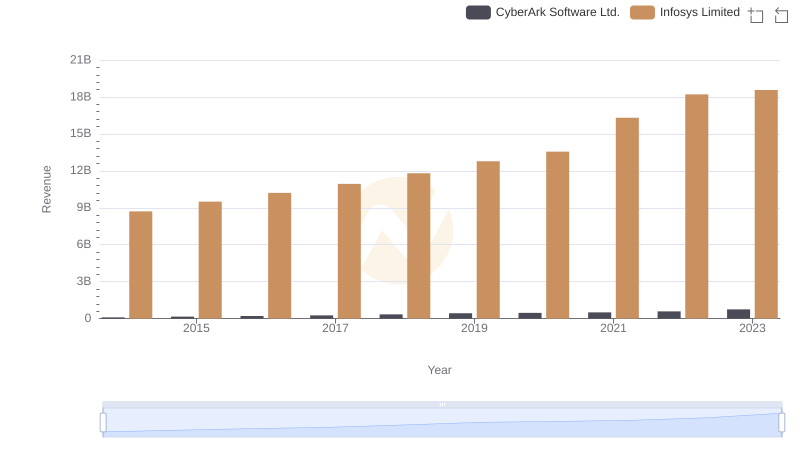
Infosys Limited or CyberArk Software Ltd.: Who Leads in Yearly Revenue?
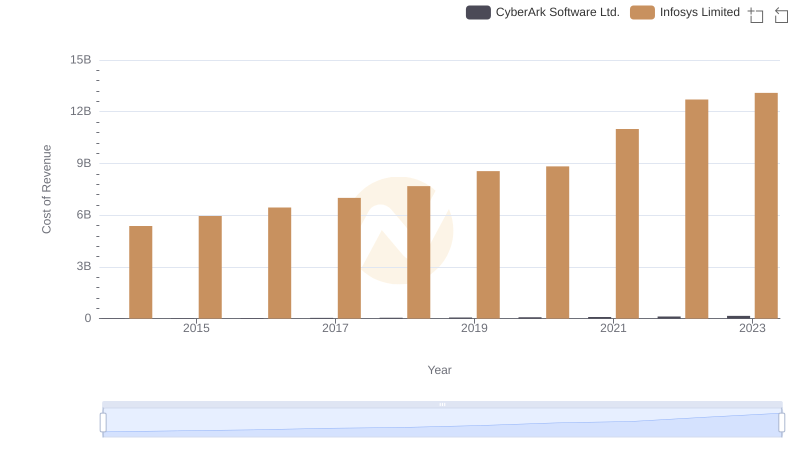
Cost of Revenue: Key Insights for Infosys Limited and CyberArk Software Ltd.
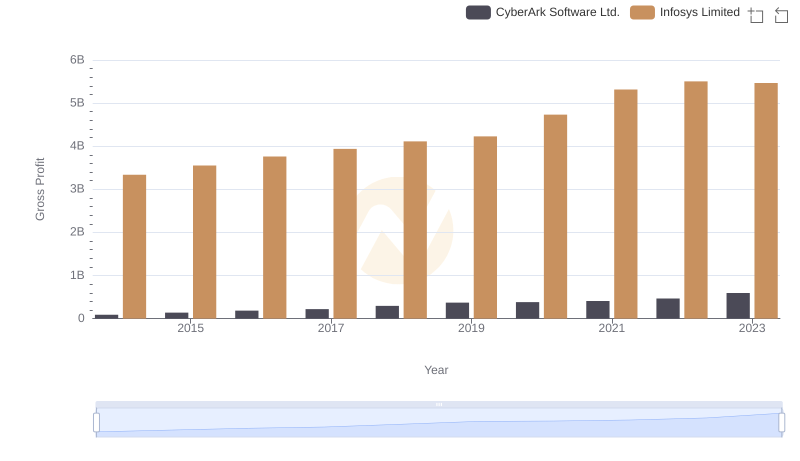
Key Insights on Gross Profit: Infosys Limited vs CyberArk Software Ltd.

Breaking Down SG&A Expenses: Infosys Limited vs Teradyne, Inc.
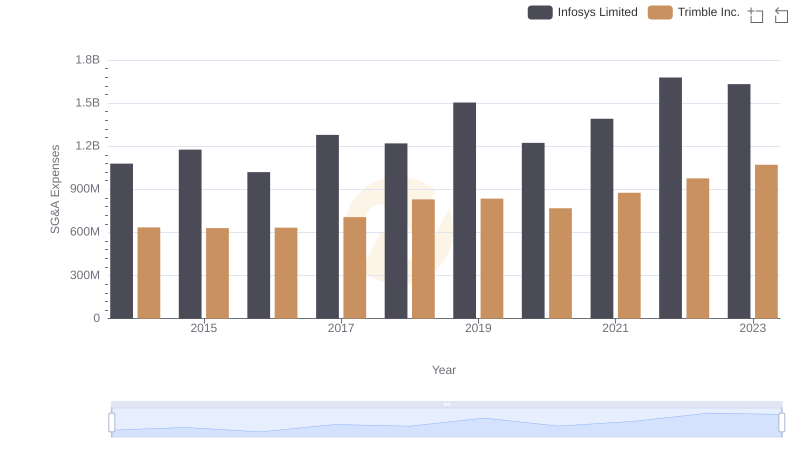
SG&A Efficiency Analysis: Comparing Infosys Limited and Trimble Inc.
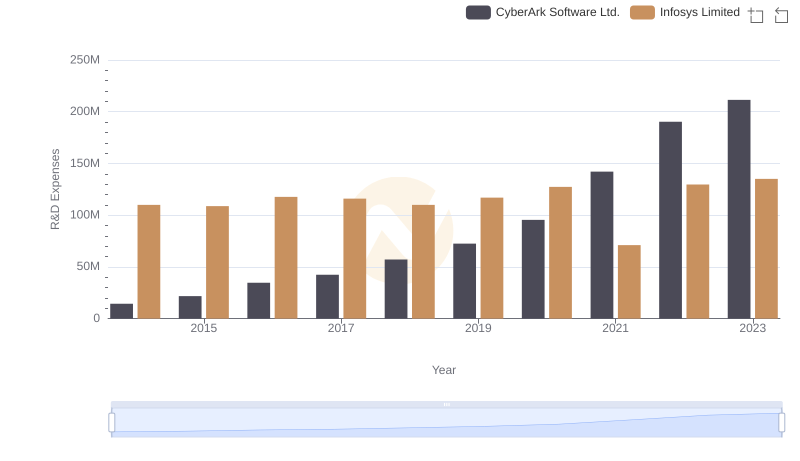
Research and Development Investment: Infosys Limited vs CyberArk Software Ltd.
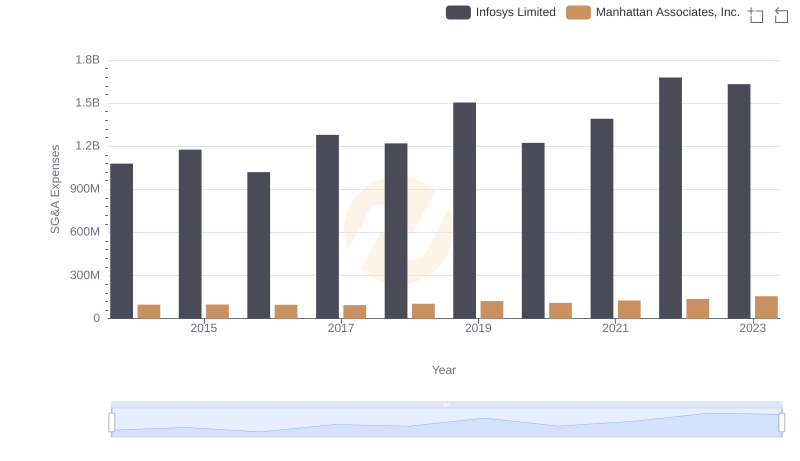
Who Optimizes SG&A Costs Better? Infosys Limited or Manhattan Associates, Inc.
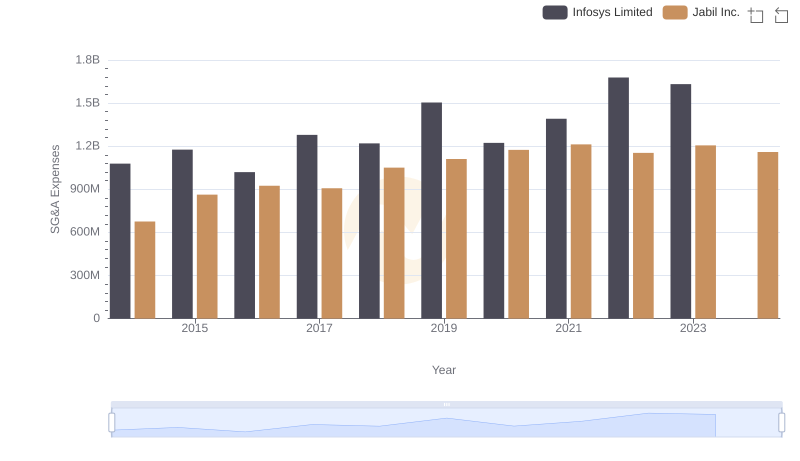
Infosys Limited and Jabil Inc.: SG&A Spending Patterns Compared
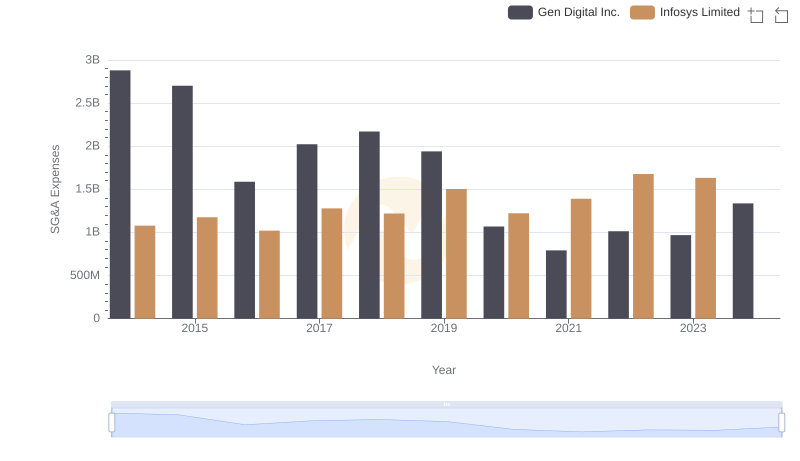
Who Optimizes SG&A Costs Better? Infosys Limited or Gen Digital Inc.
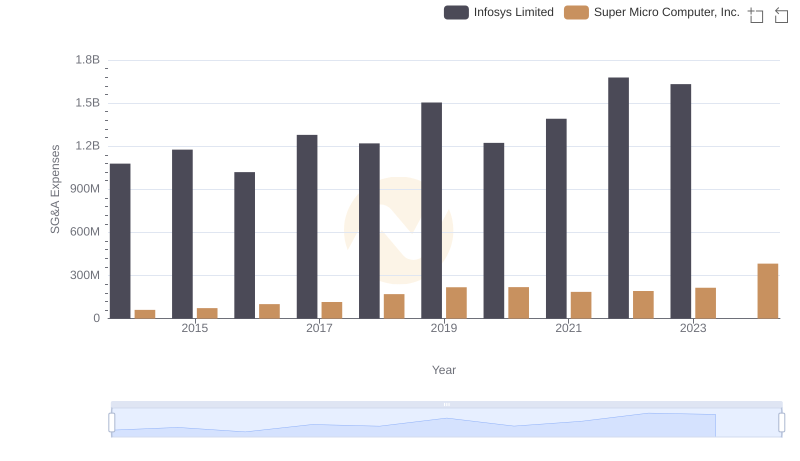
Breaking Down SG&A Expenses: Infosys Limited vs Super Micro Computer, Inc.
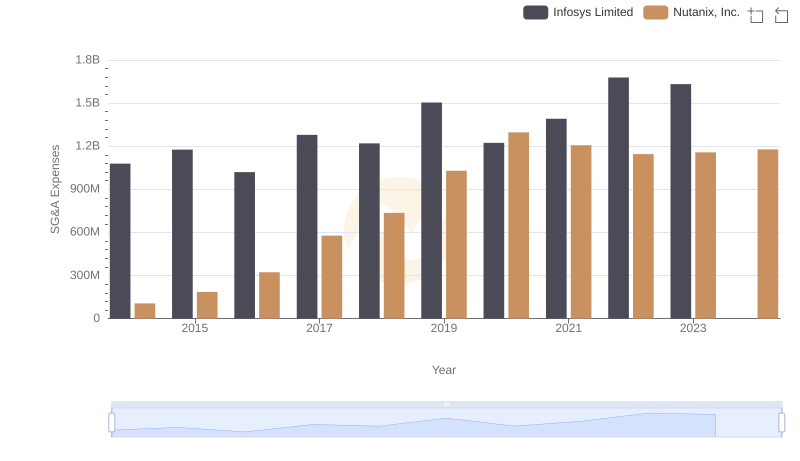
Comparing SG&A Expenses: Infosys Limited vs Nutanix, Inc. Trends and Insights
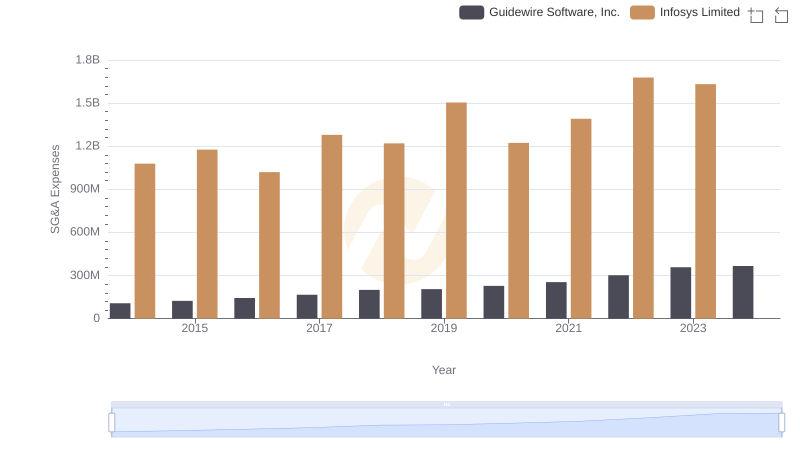
Selling, General, and Administrative Costs: Infosys Limited vs Guidewire Software, Inc.