| __timestamp | Infosys Limited | Nutanix, Inc. |
|---|---|---|
| Wednesday, January 1, 2014 | 3337000000 | 66215000 |
| Thursday, January 1, 2015 | 3551000000 | 140473000 |
| Friday, January 1, 2016 | 3762000000 | 274141000 |
| Sunday, January 1, 2017 | 3938000000 | 439538000 |
| Monday, January 1, 2018 | 4112000000 | 769427000 |
| Tuesday, January 1, 2019 | 4228000000 | 932015000 |
| Wednesday, January 1, 2020 | 4733000000 | 1020993000 |
| Friday, January 1, 2021 | 5315000000 | 1102458000 |
| Saturday, January 1, 2022 | 5503000000 | 1259640000 |
| Sunday, January 1, 2023 | 5466000000 | 1530708000 |
| Monday, January 1, 2024 | 1824704000 |
Unveiling the hidden dimensions of data
In the ever-evolving landscape of global technology, the financial performance of companies like Infosys Limited and Nutanix, Inc. offers a fascinating glimpse into their growth trajectories. From 2014 to 2023, Infosys Limited has consistently demonstrated robust growth in gross profit, with an impressive increase of over 60% during this period. In contrast, Nutanix, Inc. has shown a remarkable upward trend, with its gross profit skyrocketing by nearly 2,200%, reflecting its dynamic expansion in the tech industry.
While Infosys's gross profit peaked in 2022, Nutanix continued its upward momentum into 2024, despite missing data for Infosys in that year. This comparison highlights the diverse strategies and market positions of these two tech giants, offering valuable insights for investors and industry enthusiasts alike.
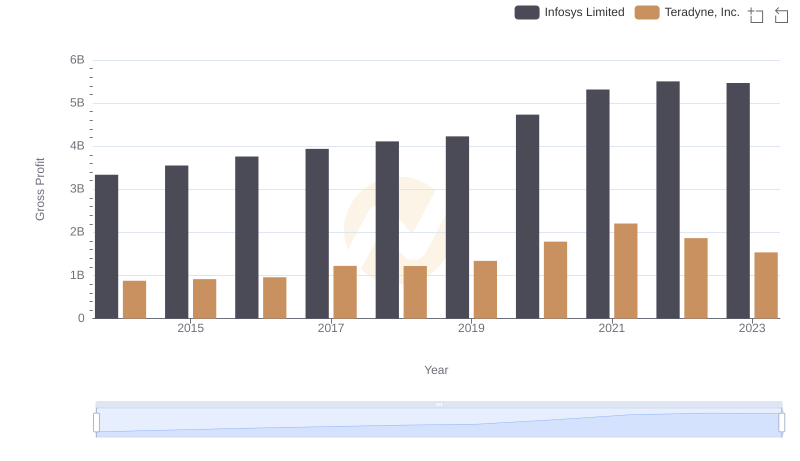
Infosys Limited vs Teradyne, Inc.: A Gross Profit Performance Breakdown
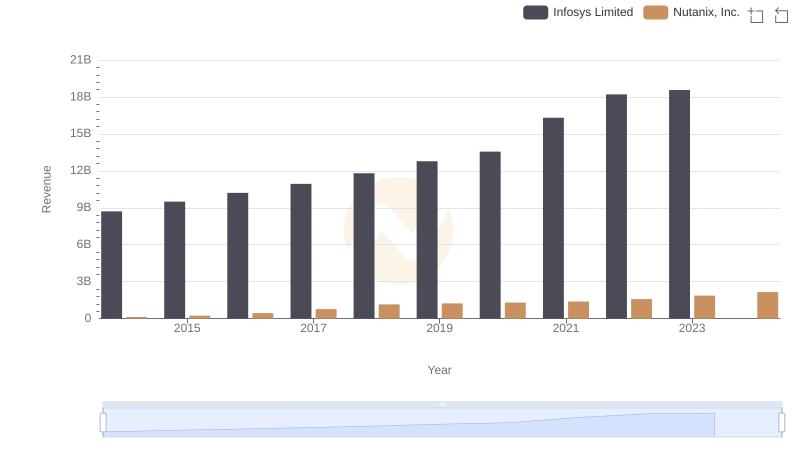
Revenue Insights: Infosys Limited and Nutanix, Inc. Performance Compared

Key Insights on Gross Profit: Infosys Limited vs Trimble Inc.
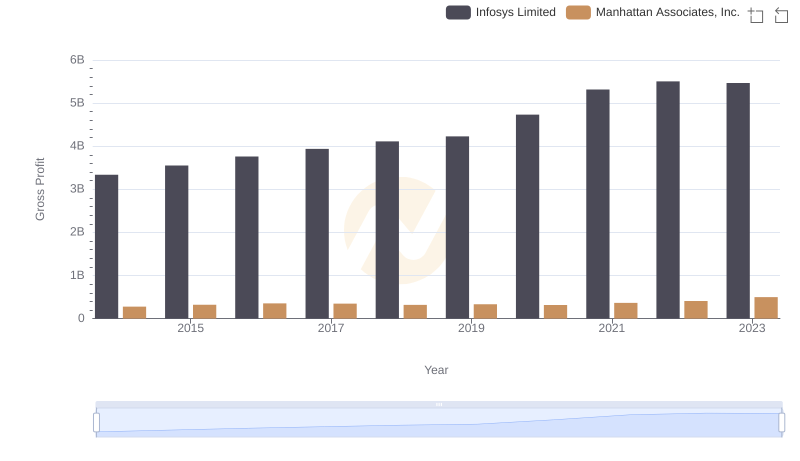
Who Generates Higher Gross Profit? Infosys Limited or Manhattan Associates, Inc.
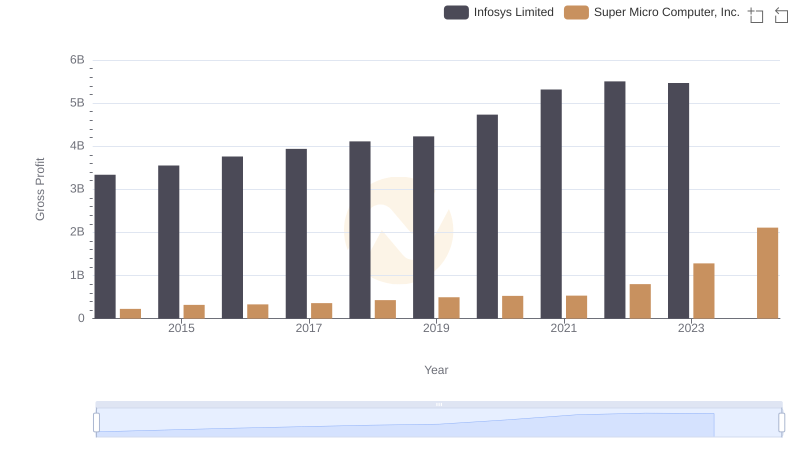
Key Insights on Gross Profit: Infosys Limited vs Super Micro Computer, Inc.
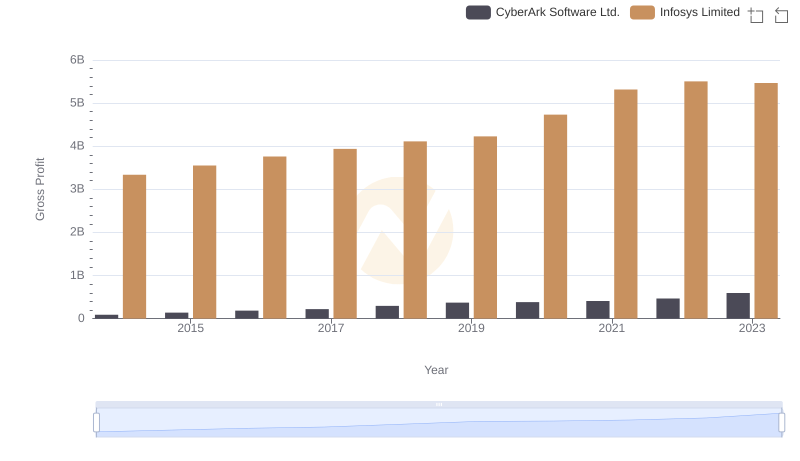
Key Insights on Gross Profit: Infosys Limited vs CyberArk Software Ltd.
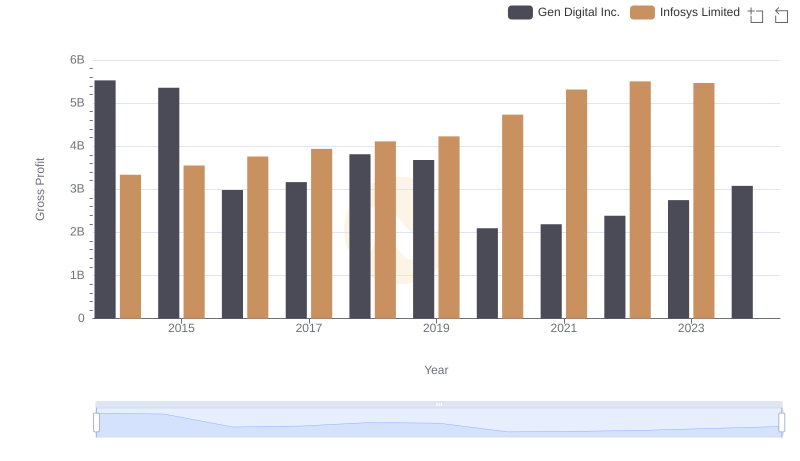
Infosys Limited vs Gen Digital Inc.: A Gross Profit Performance Breakdown
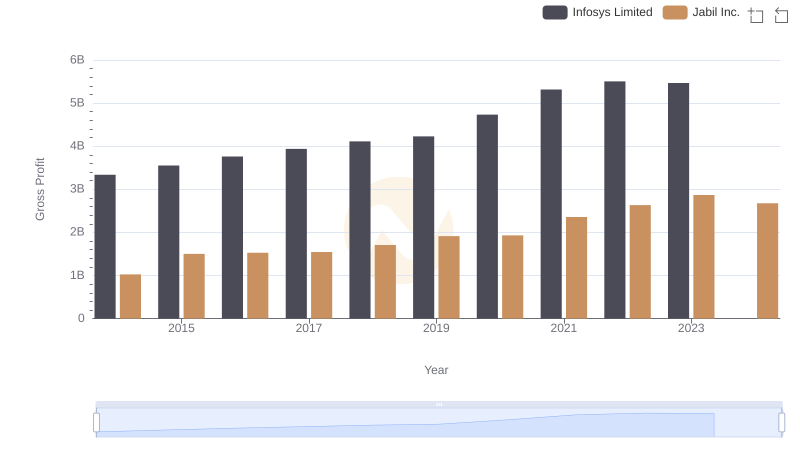
Gross Profit Comparison: Infosys Limited and Jabil Inc. Trends
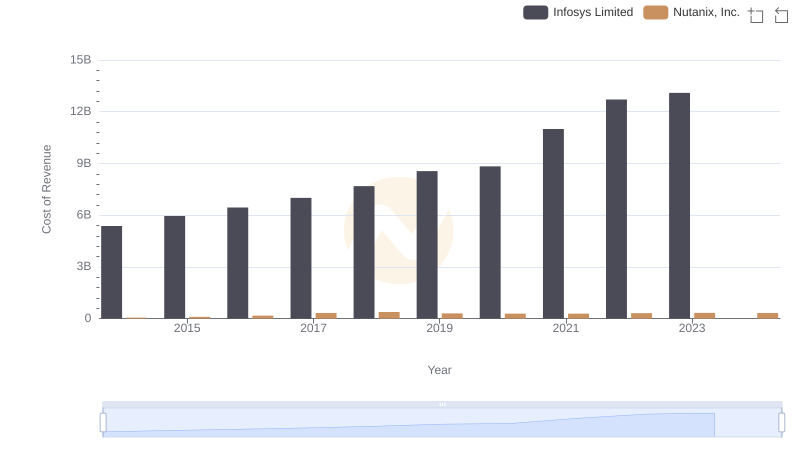
Infosys Limited vs Nutanix, Inc.: Efficiency in Cost of Revenue Explored
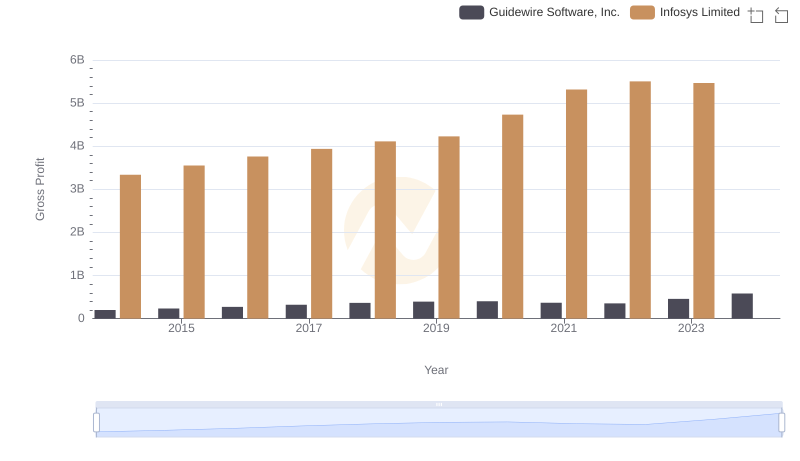
Who Generates Higher Gross Profit? Infosys Limited or Guidewire Software, Inc.
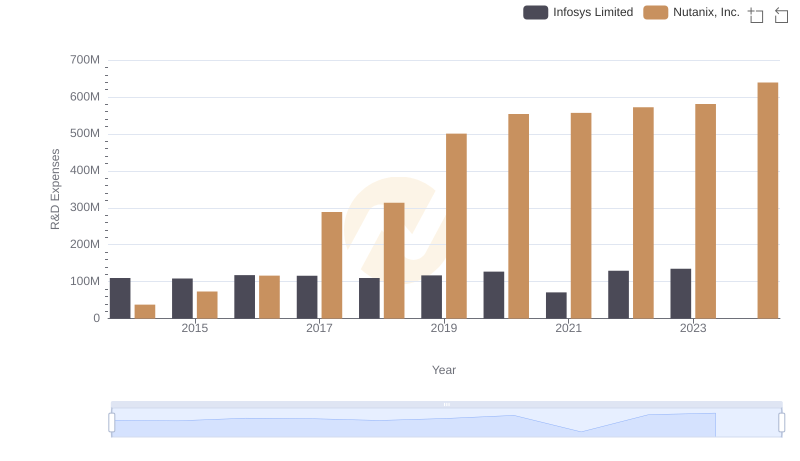
Analyzing R&D Budgets: Infosys Limited vs Nutanix, Inc.
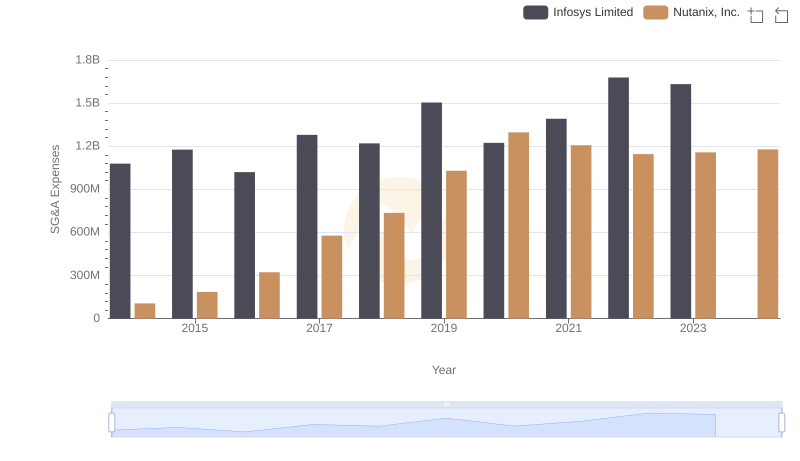
Comparing SG&A Expenses: Infosys Limited vs Nutanix, Inc. Trends and Insights