| __timestamp | Axon Enterprise, Inc. | Waste Connections, Inc. |
|---|---|---|
| Wednesday, January 1, 2014 | 164525000 | 2079166000 |
| Thursday, January 1, 2015 | 197892000 | 2117287000 |
| Friday, January 1, 2016 | 268245000 | 3375863000 |
| Sunday, January 1, 2017 | 343798000 | 4630488000 |
| Monday, January 1, 2018 | 420068000 | 4922941000 |
| Tuesday, January 1, 2019 | 530860000 | 5388679000 |
| Wednesday, January 1, 2020 | 681003000 | 5445990000 |
| Friday, January 1, 2021 | 863381000 | 6151361000 |
| Saturday, January 1, 2022 | 1189935000 | 7211859000 |
| Sunday, January 1, 2023 | 1563391000 | 8021951000 |
| Monday, January 1, 2024 | 8919591000 |
Cracking the code
In the ever-evolving landscape of corporate growth, Waste Connections, Inc. and Axon Enterprise, Inc. have demonstrated remarkable trajectories over the past decade. From 2014 to 2023, Waste Connections, Inc. has seen its revenue soar by nearly 286%, reaching a peak in 2023. This growth underscores its robust position in the waste management industry, capitalizing on increased demand and strategic acquisitions.
Meanwhile, Axon Enterprise, Inc., a leader in public safety technology, has experienced an impressive revenue growth of approximately 849% over the same period. This surge reflects the company's innovative approach and expanding market presence, particularly in law enforcement and public safety sectors.
Both companies exemplify how strategic focus and market adaptation can lead to substantial financial success. As we look to the future, these trends highlight the dynamic nature of industry growth and the potential for continued expansion.
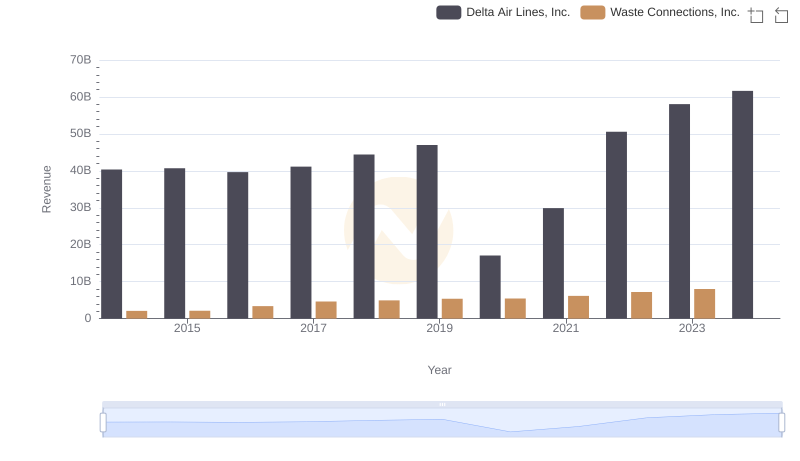
Comparing Revenue Performance: Waste Connections, Inc. or Delta Air Lines, Inc.?
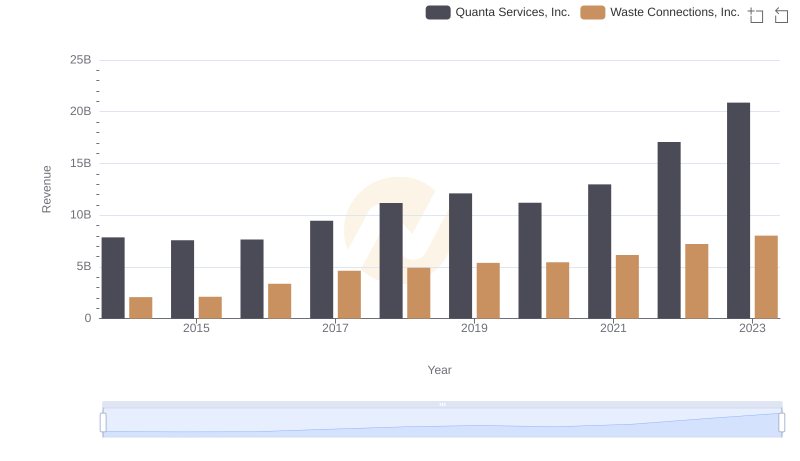
Comparing Revenue Performance: Waste Connections, Inc. or Quanta Services, Inc.?
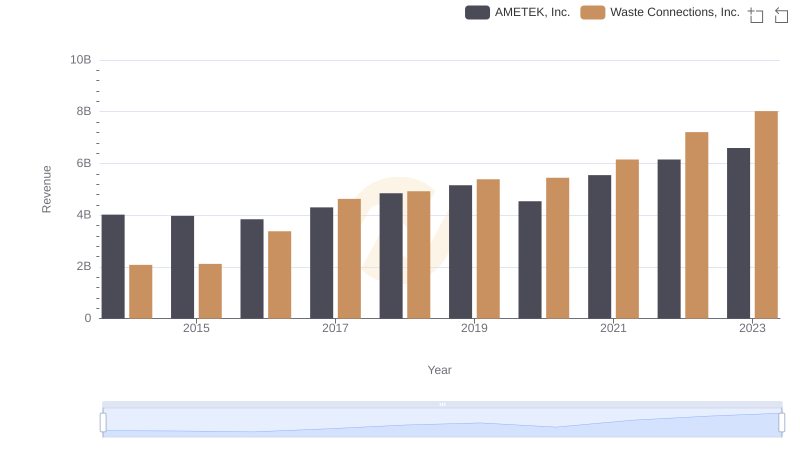
Revenue Insights: Waste Connections, Inc. and AMETEK, Inc. Performance Compared
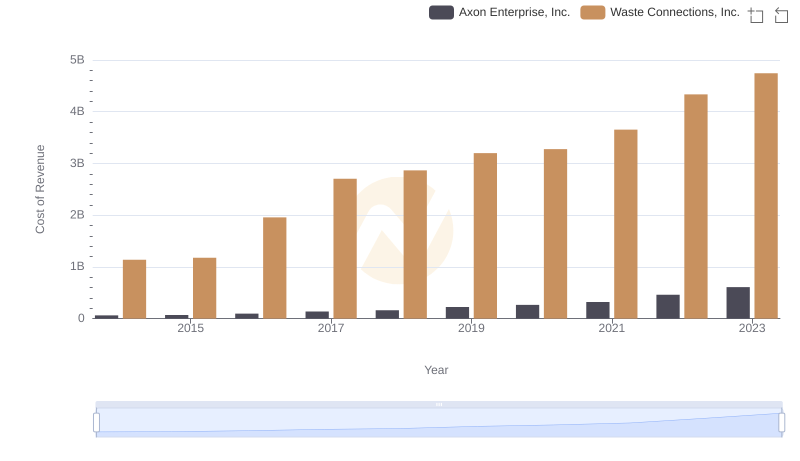
Cost of Revenue Comparison: Waste Connections, Inc. vs Axon Enterprise, Inc.
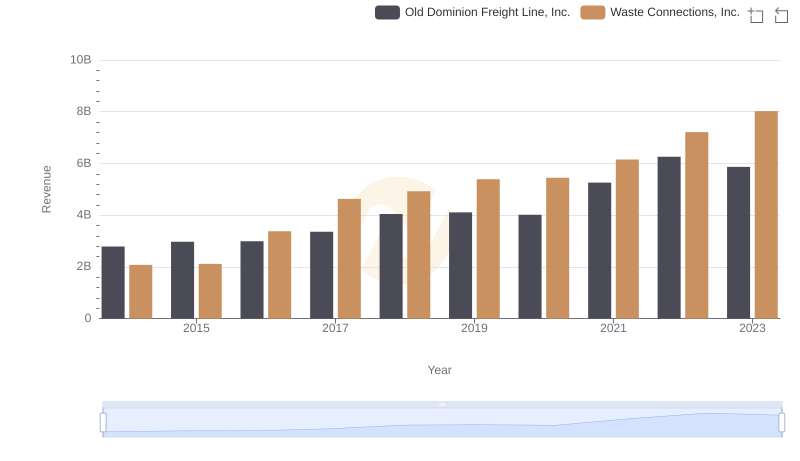
Waste Connections, Inc. and Old Dominion Freight Line, Inc.: A Comprehensive Revenue Analysis
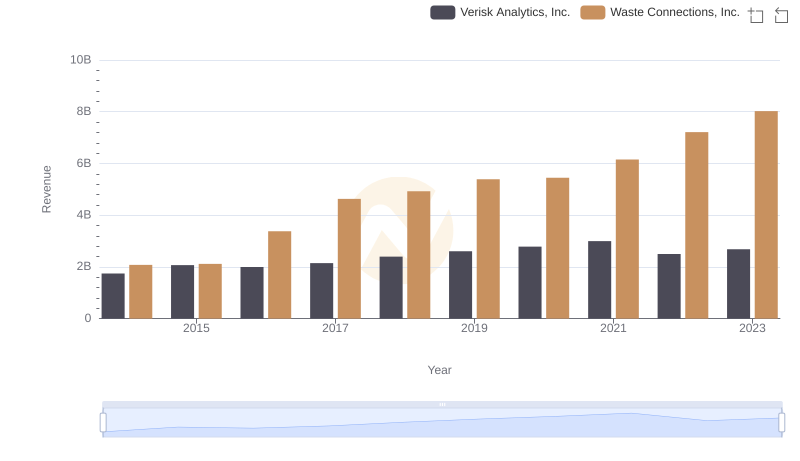
Revenue Showdown: Waste Connections, Inc. vs Verisk Analytics, Inc.
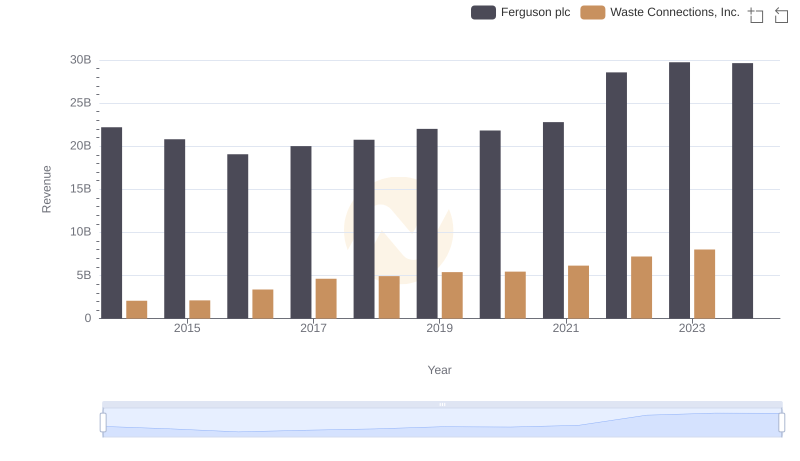
Comparing Revenue Performance: Waste Connections, Inc. or Ferguson plc?
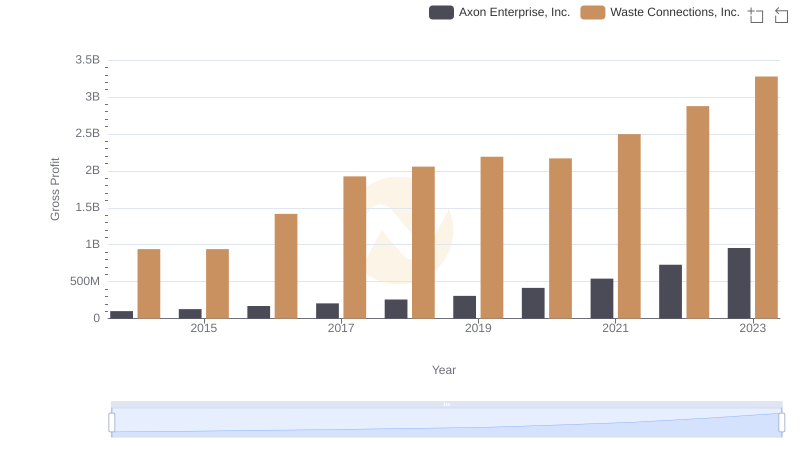
Who Generates Higher Gross Profit? Waste Connections, Inc. or Axon Enterprise, Inc.
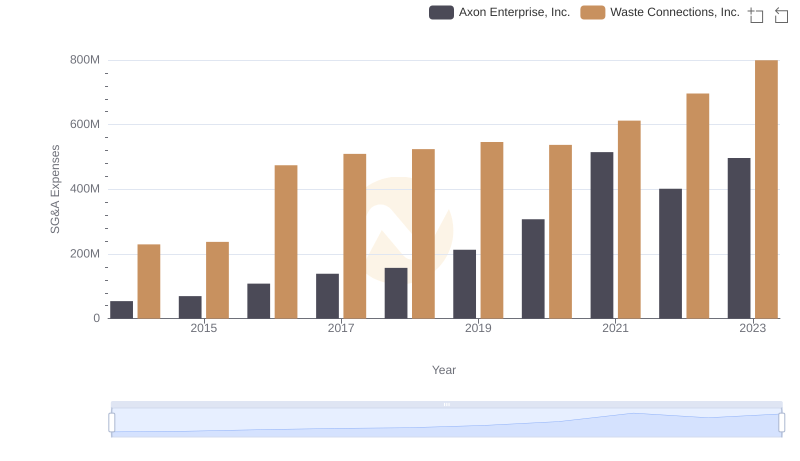
Waste Connections, Inc. vs Axon Enterprise, Inc.: SG&A Expense Trends