| __timestamp | Verisk Analytics, Inc. | Waste Connections, Inc. |
|---|---|---|
| Wednesday, January 1, 2014 | 1746726000 | 2079166000 |
| Thursday, January 1, 2015 | 2068010000 | 2117287000 |
| Friday, January 1, 2016 | 1995200000 | 3375863000 |
| Sunday, January 1, 2017 | 2145200000 | 4630488000 |
| Monday, January 1, 2018 | 2395100000 | 4922941000 |
| Tuesday, January 1, 2019 | 2607100000 | 5388679000 |
| Wednesday, January 1, 2020 | 2784600000 | 5445990000 |
| Friday, January 1, 2021 | 2998600000 | 6151361000 |
| Saturday, January 1, 2022 | 2497000000 | 7211859000 |
| Sunday, January 1, 2023 | 2681400000 | 8021951000 |
| Monday, January 1, 2024 | 8919591000 |
In pursuit of knowledge
In the competitive landscape of waste management and data analytics, Waste Connections, Inc. and Verisk Analytics, Inc. have been key players. Over the past decade, Waste Connections has consistently outpaced Verisk Analytics in revenue growth. From 2014 to 2023, Waste Connections saw its revenue soar by approximately 286%, reaching a peak in 2023. In contrast, Verisk Analytics experienced a more modest growth of around 53% during the same period.
Waste Connections' impressive growth trajectory can be attributed to strategic acquisitions and expanding service offerings, while Verisk Analytics has focused on enhancing its data analytics capabilities. Despite the different industry focuses, both companies have shown resilience and adaptability in their respective markets. As we look to the future, the question remains: will Waste Connections continue its upward momentum, or will Verisk Analytics close the gap with innovative solutions?
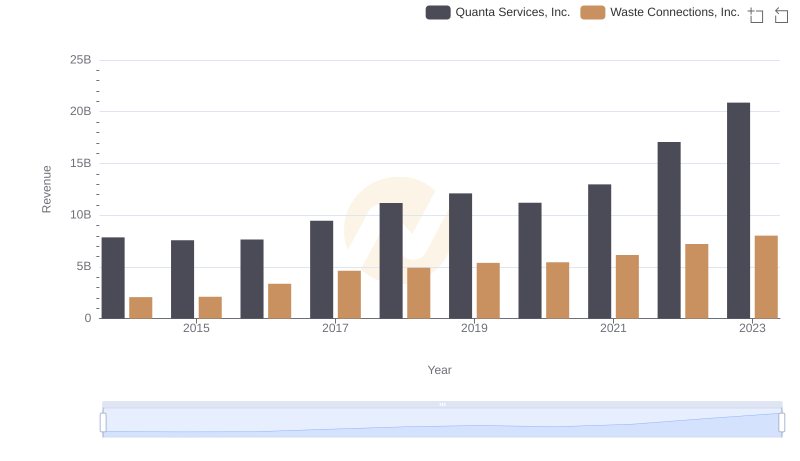
Comparing Revenue Performance: Waste Connections, Inc. or Quanta Services, Inc.?
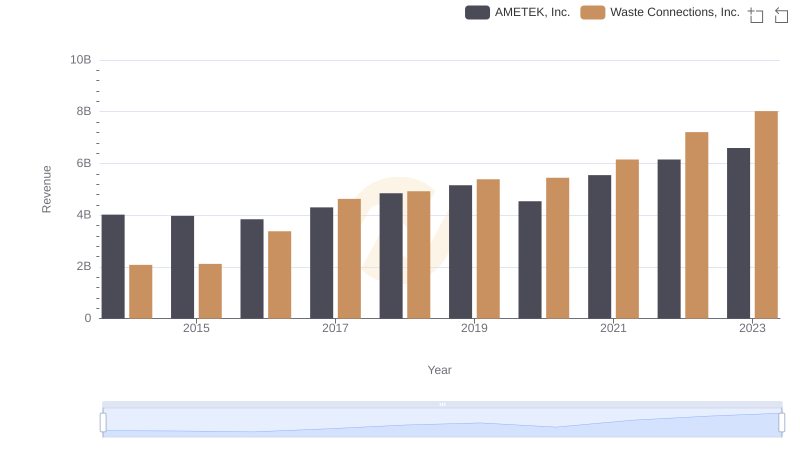
Revenue Insights: Waste Connections, Inc. and AMETEK, Inc. Performance Compared
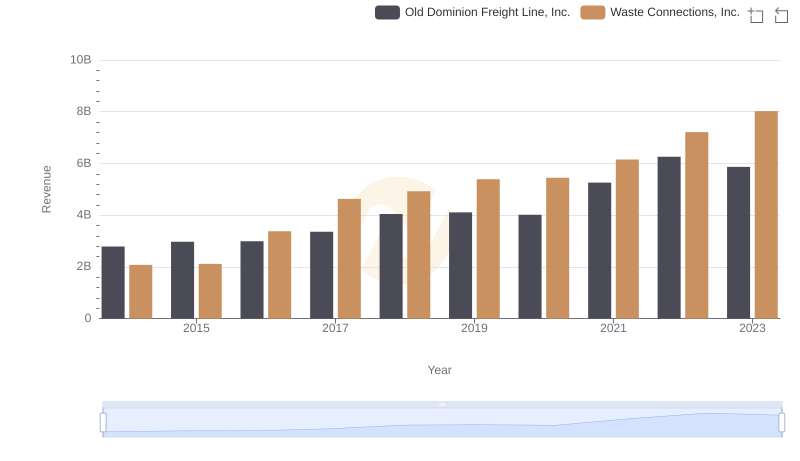
Waste Connections, Inc. and Old Dominion Freight Line, Inc.: A Comprehensive Revenue Analysis
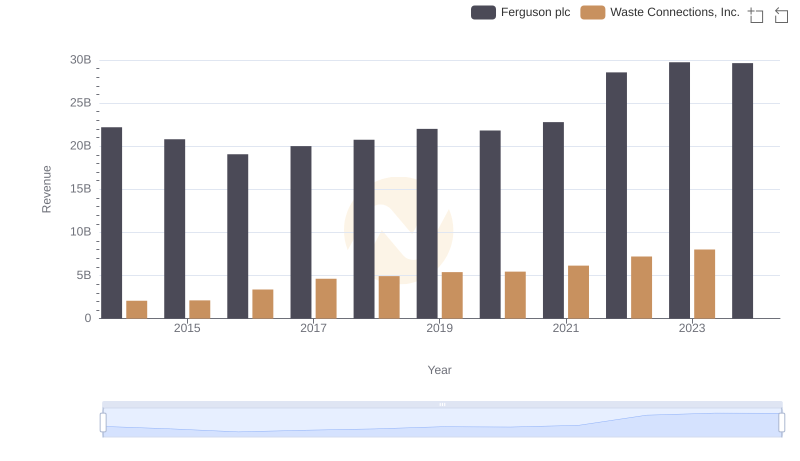
Comparing Revenue Performance: Waste Connections, Inc. or Ferguson plc?
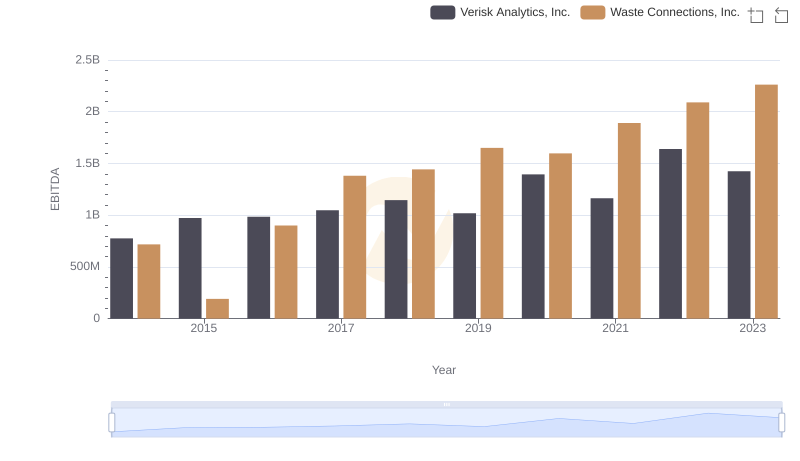
EBITDA Performance Review: Waste Connections, Inc. vs Verisk Analytics, Inc.