| __timestamp | Delta Air Lines, Inc. | Waste Connections, Inc. |
|---|---|---|
| Wednesday, January 1, 2014 | 40362000000 | 2079166000 |
| Thursday, January 1, 2015 | 40704000000 | 2117287000 |
| Friday, January 1, 2016 | 39639000000 | 3375863000 |
| Sunday, January 1, 2017 | 41138000000 | 4630488000 |
| Monday, January 1, 2018 | 44438000000 | 4922941000 |
| Tuesday, January 1, 2019 | 47007000000 | 5388679000 |
| Wednesday, January 1, 2020 | 17095000000 | 5445990000 |
| Friday, January 1, 2021 | 29899000000 | 6151361000 |
| Saturday, January 1, 2022 | 50582000000 | 7211859000 |
| Sunday, January 1, 2023 | 58048000000 | 8021951000 |
| Monday, January 1, 2024 | 61643000000 | 8919591000 |
Infusing magic into the data realm
In the ever-evolving landscape of American industries, Delta Air Lines, Inc. and Waste Connections, Inc. offer a fascinating study in contrasts. Over the past decade, Delta Air Lines has soared, with its revenue peaking at an impressive 61.6 billion in 2024, a remarkable 53% increase from 2014. However, the pandemic year of 2020 saw a dramatic dip, with revenues plummeting to just 17 billion, highlighting the industry's vulnerability to global disruptions.
Conversely, Waste Connections, Inc. has shown steady growth, with revenues climbing from 2.1 billion in 2014 to 8 billion in 2023, marking a robust 285% increase. This consistent upward trajectory underscores the resilience and essential nature of waste management services. While Delta's revenue data for 2024 is available, Waste Connections' figures remain elusive, leaving room for speculation on its future performance.
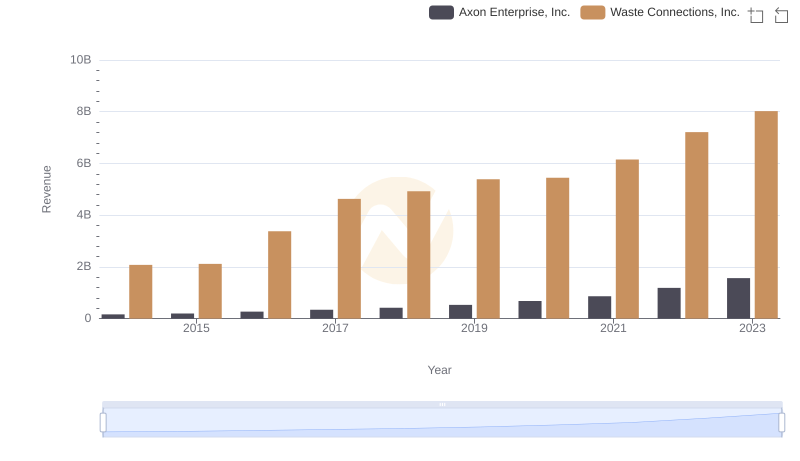
Waste Connections, Inc. vs Axon Enterprise, Inc.: Annual Revenue Growth Compared
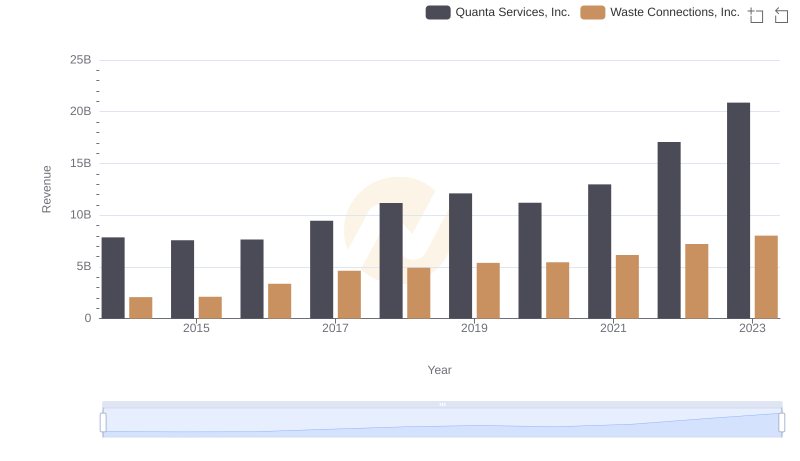
Comparing Revenue Performance: Waste Connections, Inc. or Quanta Services, Inc.?
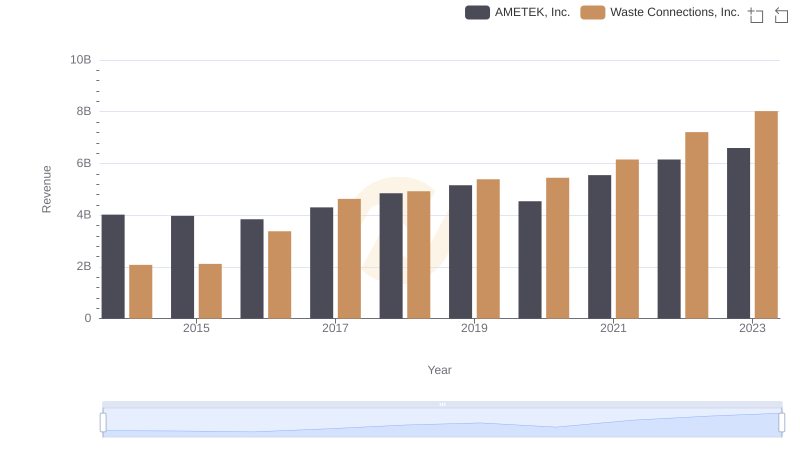
Revenue Insights: Waste Connections, Inc. and AMETEK, Inc. Performance Compared
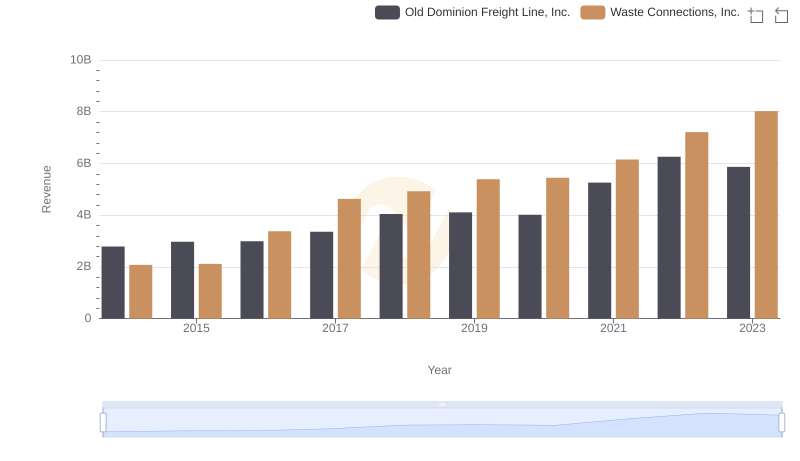
Waste Connections, Inc. and Old Dominion Freight Line, Inc.: A Comprehensive Revenue Analysis
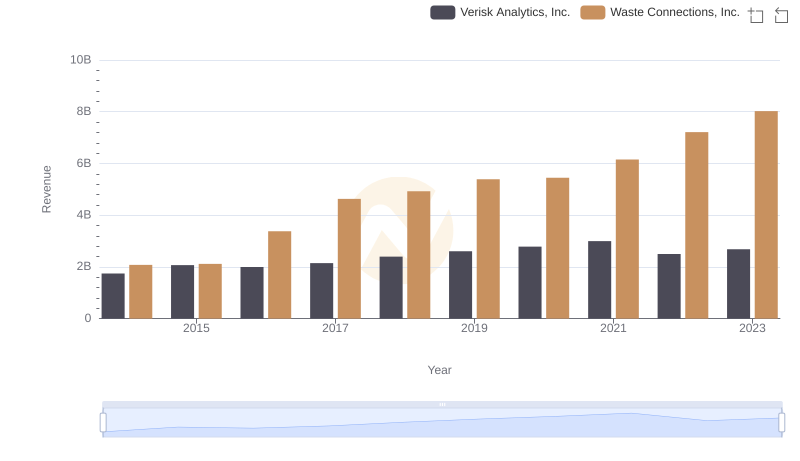
Revenue Showdown: Waste Connections, Inc. vs Verisk Analytics, Inc.
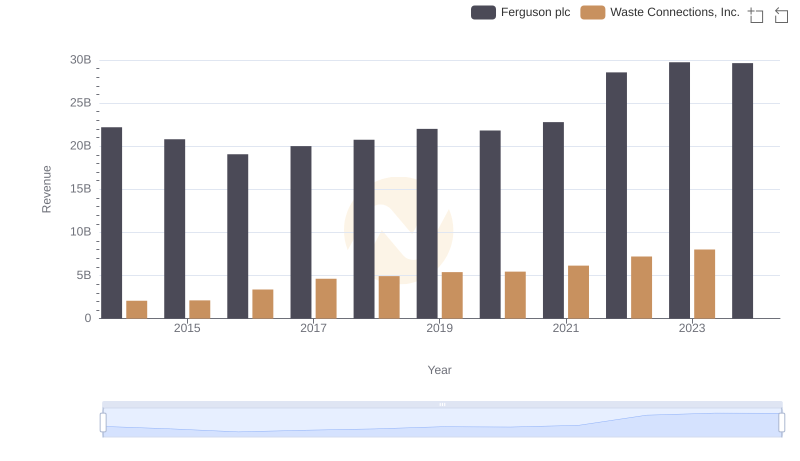
Comparing Revenue Performance: Waste Connections, Inc. or Ferguson plc?
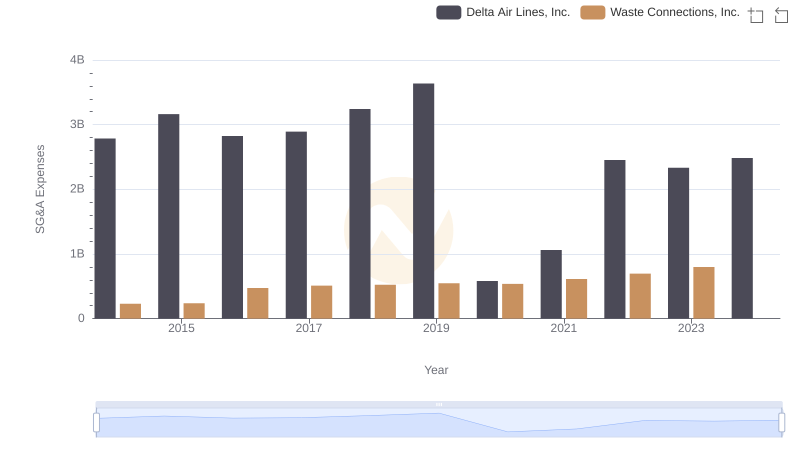
Waste Connections, Inc. vs Delta Air Lines, Inc.: SG&A Expense Trends