| __timestamp | Equifax Inc. | Textron Inc. |
|---|---|---|
| Wednesday, January 1, 2014 | 2436400000 | 13878000000 |
| Thursday, January 1, 2015 | 2663600000 | 13423000000 |
| Friday, January 1, 2016 | 3144900000 | 13788000000 |
| Sunday, January 1, 2017 | 3362200000 | 14198000000 |
| Monday, January 1, 2018 | 3412100000 | 13972000000 |
| Tuesday, January 1, 2019 | 3507600000 | 13630000000 |
| Wednesday, January 1, 2020 | 4127500000 | 11651000000 |
| Friday, January 1, 2021 | 4923900000 | 12382000000 |
| Saturday, January 1, 2022 | 5122200000 | 12869000000 |
| Sunday, January 1, 2023 | 5265200000 | 13683000000 |
| Monday, January 1, 2024 | 5681100000 | 13702000000 |
Unveiling the hidden dimensions of data
In the ever-evolving landscape of American business, Equifax Inc. and Textron Inc. stand as titans in their respective industries. From 2014 to 2023, these companies have showcased distinct revenue trajectories. Equifax, a leader in consumer credit reporting, saw its revenue grow by over 116% during this period, peaking in 2023. Meanwhile, Textron, a conglomerate known for its aviation and defense products, maintained a steady revenue stream, with a slight dip in 2020, likely due to global disruptions. By 2023, Textron's revenue was approximately 2.6 times that of Equifax, highlighting its robust market presence. However, the data for 2024 is incomplete, leaving room for speculation on future trends. This comparison not only underscores the resilience of these companies but also offers insights into their strategic adaptations in a dynamic economic environment.
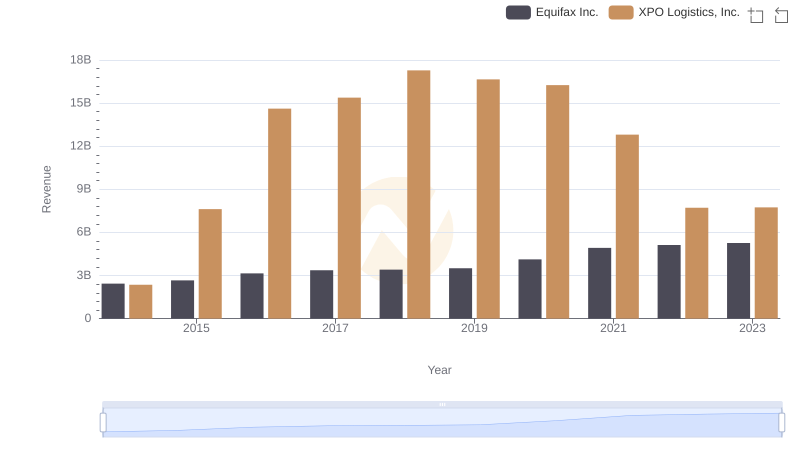
Equifax Inc. or XPO Logistics, Inc.: Who Leads in Yearly Revenue?
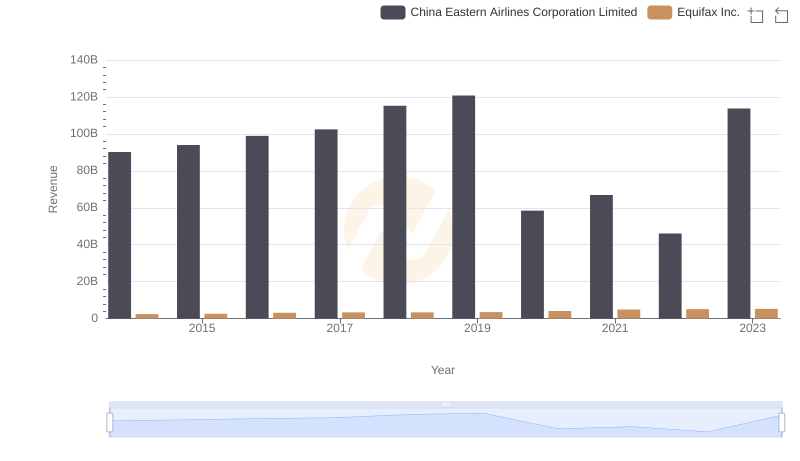
Breaking Down Revenue Trends: Equifax Inc. vs China Eastern Airlines Corporation Limited
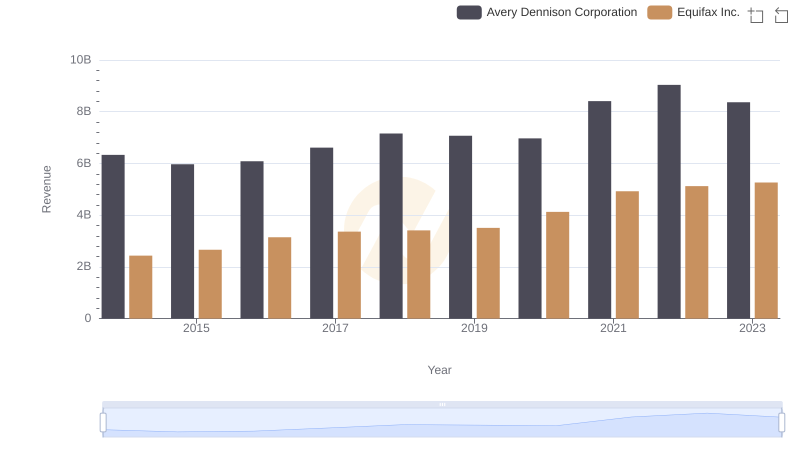
Equifax Inc. and Avery Dennison Corporation: A Comprehensive Revenue Analysis
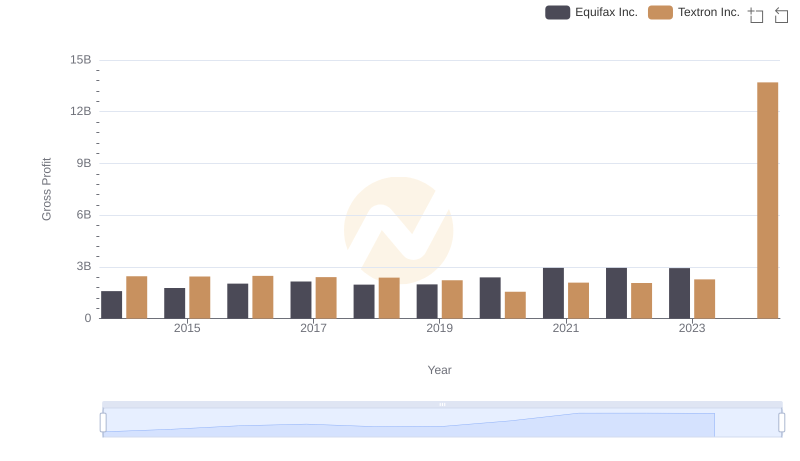
Key Insights on Gross Profit: Equifax Inc. vs Textron Inc.
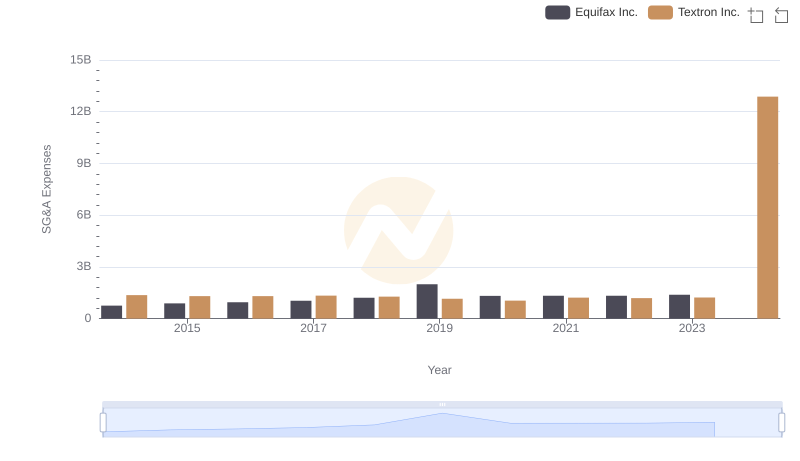
Equifax Inc. vs Textron Inc.: SG&A Expense Trends
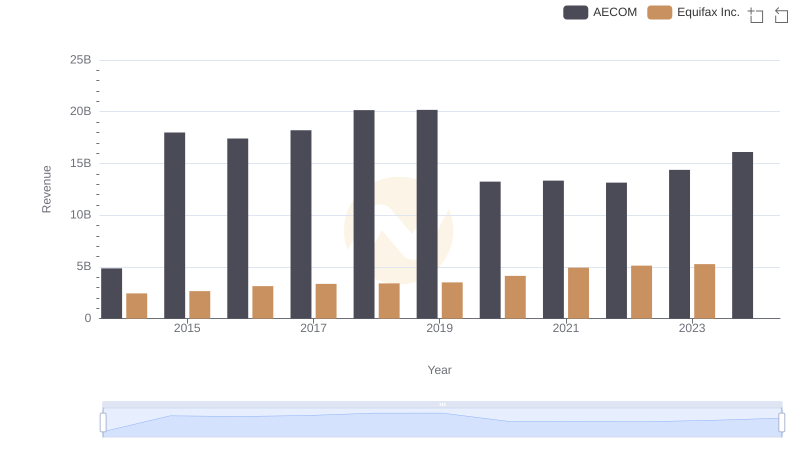
Breaking Down Revenue Trends: Equifax Inc. vs AECOM
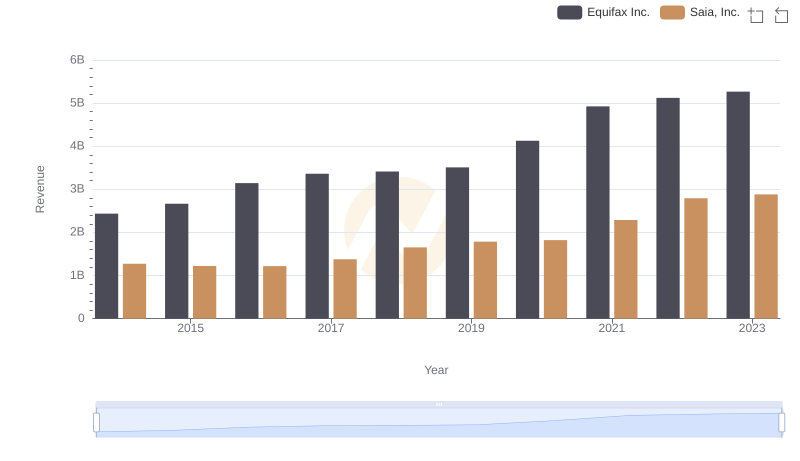
Comparing Revenue Performance: Equifax Inc. or Saia, Inc.?