| __timestamp | Equifax Inc. | Textron Inc. |
|---|---|---|
| Wednesday, January 1, 2014 | 751700000 | 1361000000 |
| Thursday, January 1, 2015 | 884300000 | 1304000000 |
| Friday, January 1, 2016 | 948200000 | 1304000000 |
| Sunday, January 1, 2017 | 1039100000 | 1337000000 |
| Monday, January 1, 2018 | 1213300000 | 1275000000 |
| Tuesday, January 1, 2019 | 1990200000 | 1152000000 |
| Wednesday, January 1, 2020 | 1322500000 | 1045000000 |
| Friday, January 1, 2021 | 1324600000 | 1221000000 |
| Saturday, January 1, 2022 | 1328900000 | 1186000000 |
| Sunday, January 1, 2023 | 1385700000 | 1225000000 |
| Monday, January 1, 2024 | 1450500000 | 1156000000 |
In pursuit of knowledge
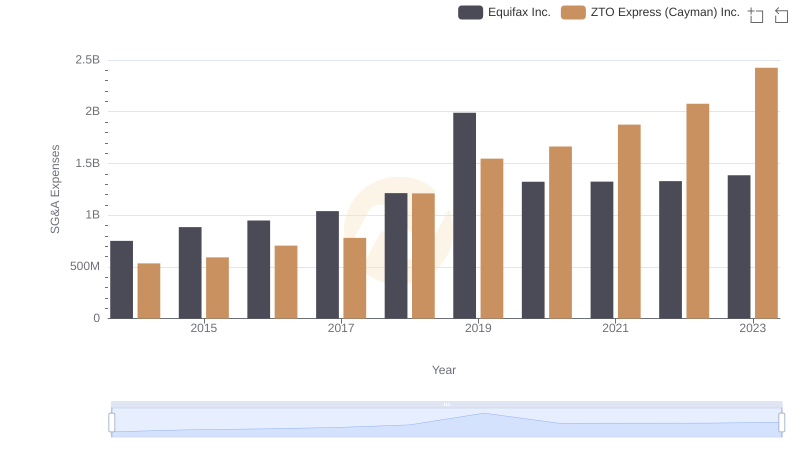
In the ever-evolving landscape of corporate finance, understanding the trends in Selling, General, and Administrative (SG&A) expenses is crucial for investors and analysts alike. Over the past decade, Equifax Inc. and Textron Inc. have shown distinct trajectories in their SG&A expenditures. From 2014 to 2023, Equifax's SG&A expenses have grown by approximately 84%, peaking in 2019. This surge reflects strategic investments and operational expansions. In contrast, Textron's expenses remained relatively stable, with a notable spike in 2024, suggesting a significant strategic shift or acquisition. The data highlights the dynamic nature of corporate strategies and their financial implications. Missing data for Equifax in 2024 suggests a potential reporting delay or strategic realignment. As businesses navigate economic challenges, these trends offer valuable insights into their operational priorities and financial health.
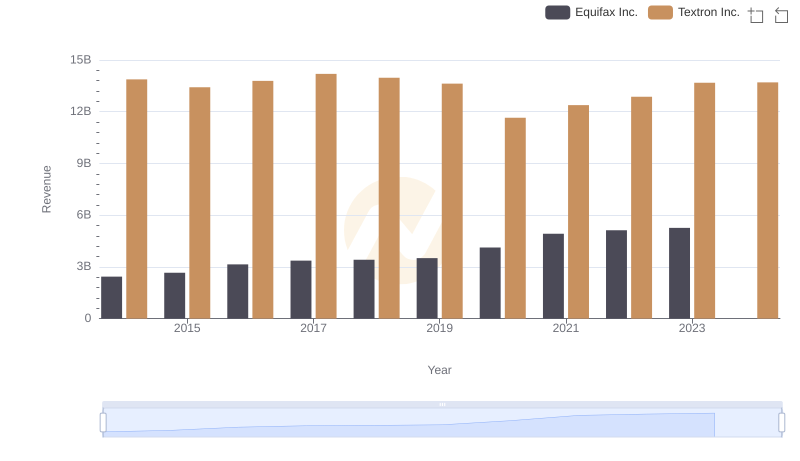
Comparing Revenue Performance: Equifax Inc. or Textron Inc.?
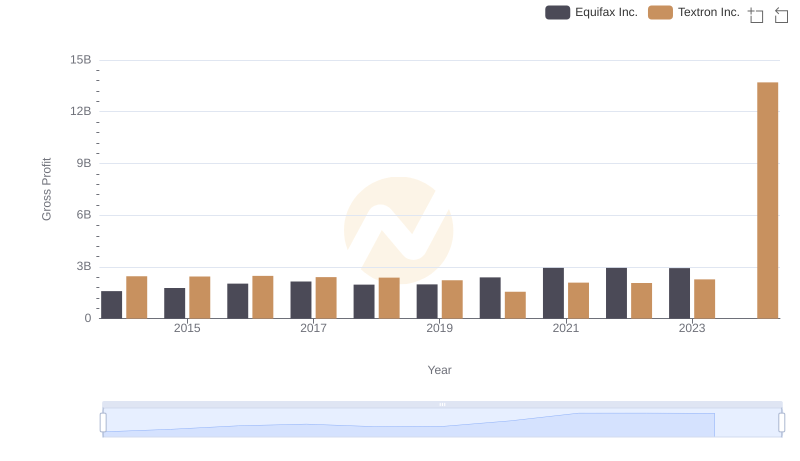
Key Insights on Gross Profit: Equifax Inc. vs Textron Inc.
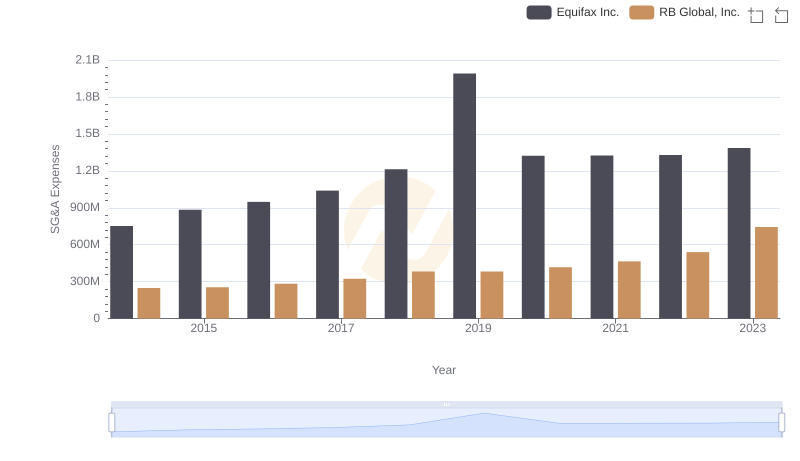
Selling, General, and Administrative Costs: Equifax Inc. vs RB Global, Inc.
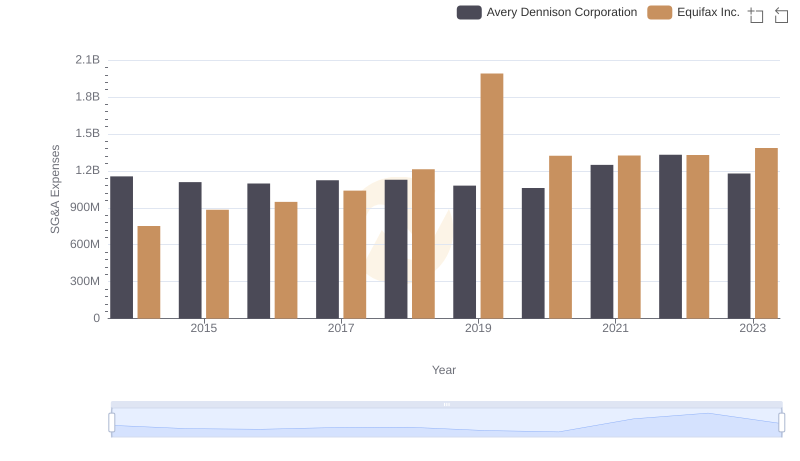
Breaking Down SG&A Expenses: Equifax Inc. vs Avery Dennison Corporation
Who Optimizes SG&A Costs Better? Equifax Inc. or ZTO Express (Cayman) Inc.