| __timestamp | CSX Corporation | Cintas Corporation |
|---|---|---|
| Wednesday, January 1, 2014 | 12669000000 | 4551812000 |
| Thursday, January 1, 2015 | 11811000000 | 4476886000 |
| Friday, January 1, 2016 | 11069000000 | 4905458000 |
| Sunday, January 1, 2017 | 11408000000 | 5323381000 |
| Monday, January 1, 2018 | 12250000000 | 6476632000 |
| Tuesday, January 1, 2019 | 11937000000 | 6892303000 |
| Wednesday, January 1, 2020 | 10583000000 | 7085120000 |
| Friday, January 1, 2021 | 12522000000 | 7116340000 |
| Saturday, January 1, 2022 | 14853000000 | 7854459000 |
| Sunday, January 1, 2023 | 14657000000 | 8815769000 |
| Monday, January 1, 2024 | 9596615000 |
In pursuit of knowledge
In the competitive landscape of American industry, Cintas Corporation and CSX Corporation stand as titans in their respective fields. Over the past decade, from 2014 to 2023, these companies have demonstrated remarkable revenue trajectories.
Cintas Corporation, a leader in corporate identity uniform programs, has seen its revenue grow by approximately 94% over this period. Starting at around $4.6 billion in 2014, Cintas reached nearly $8.8 billion by 2023, showcasing a consistent upward trend. This growth reflects the company's strategic expansion and robust market demand.
Meanwhile, CSX Corporation, a major player in the transportation sector, experienced a more fluctuating revenue pattern. Despite a dip in 2020, CSX rebounded strongly, achieving a peak revenue of $14.9 billion in 2022, a 17% increase from 2014. However, 2023 saw a slight decline, indicating potential market challenges.
Both companies exemplify resilience and adaptability, navigating economic shifts with strategic foresight.
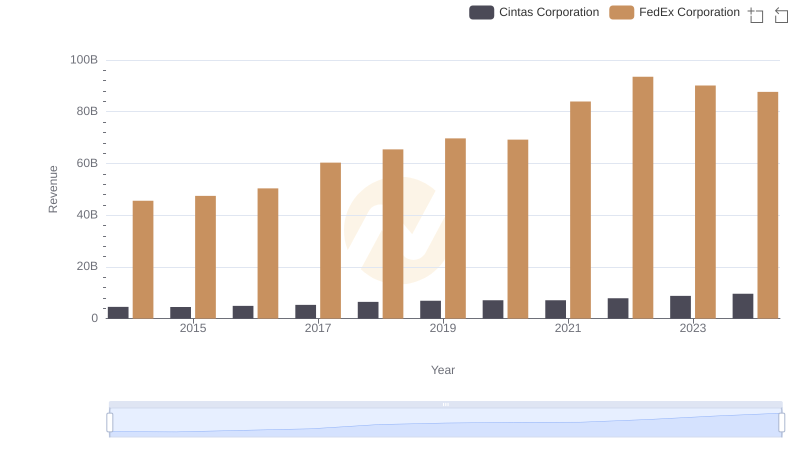
Cintas Corporation vs FedEx Corporation: Annual Revenue Growth Compared
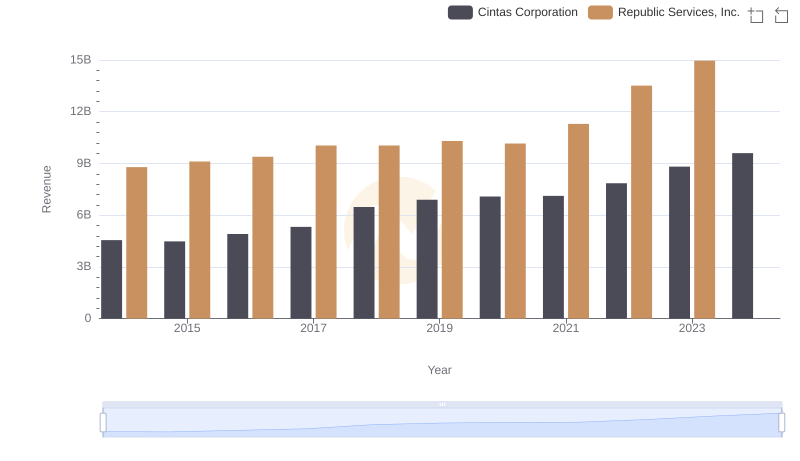
Cintas Corporation or Republic Services, Inc.: Who Leads in Yearly Revenue?
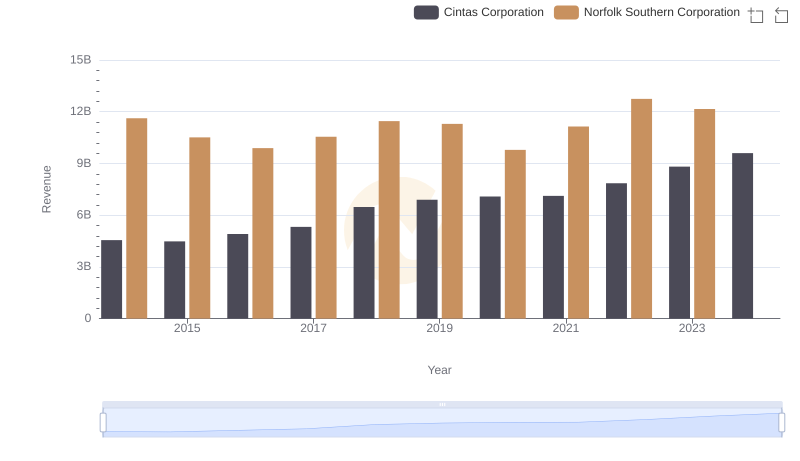
Cintas Corporation or Norfolk Southern Corporation: Who Leads in Yearly Revenue?
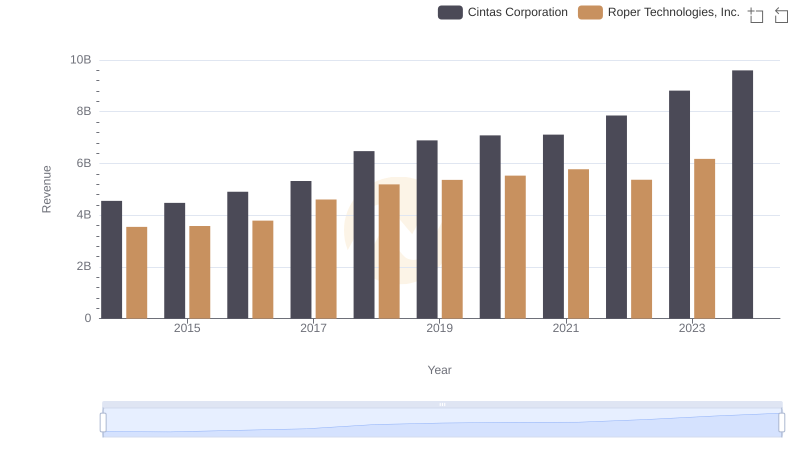
Comparing Revenue Performance: Cintas Corporation or Roper Technologies, Inc.?
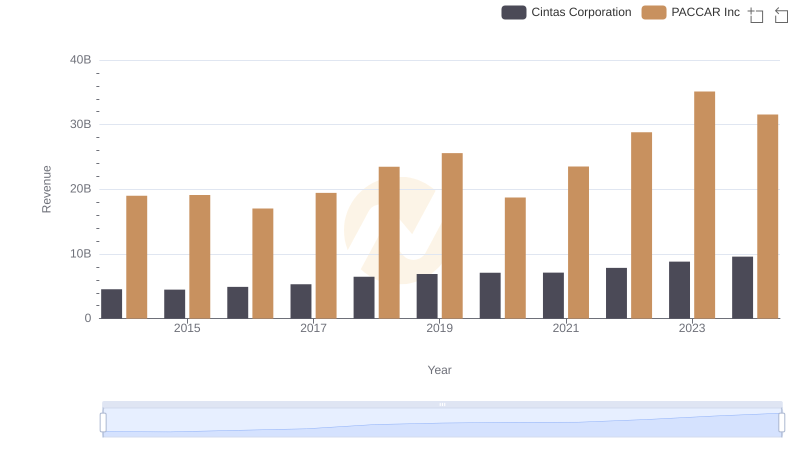
Who Generates More Revenue? Cintas Corporation or PACCAR Inc
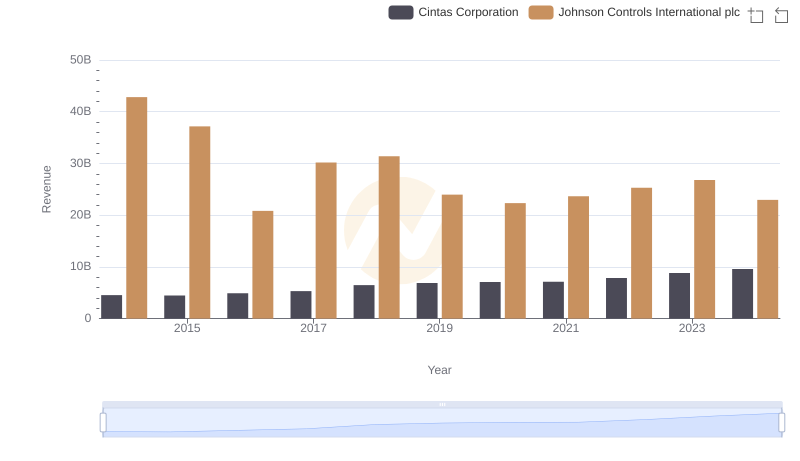
Comparing Revenue Performance: Cintas Corporation or Johnson Controls International plc?
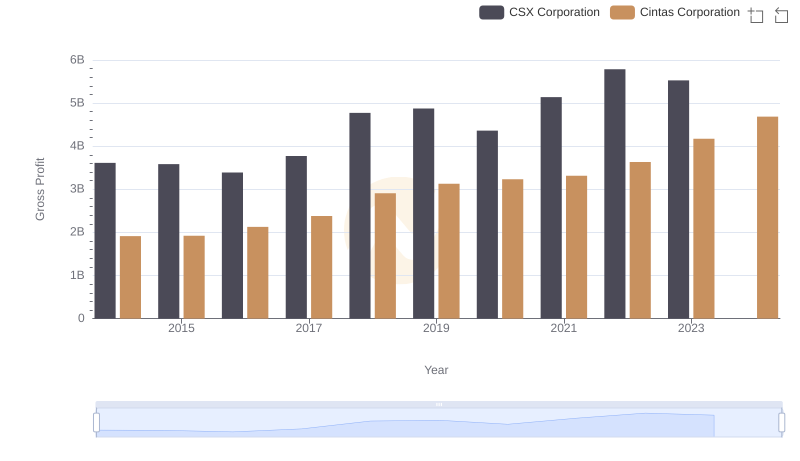
Cintas Corporation vs CSX Corporation: A Gross Profit Performance Breakdown
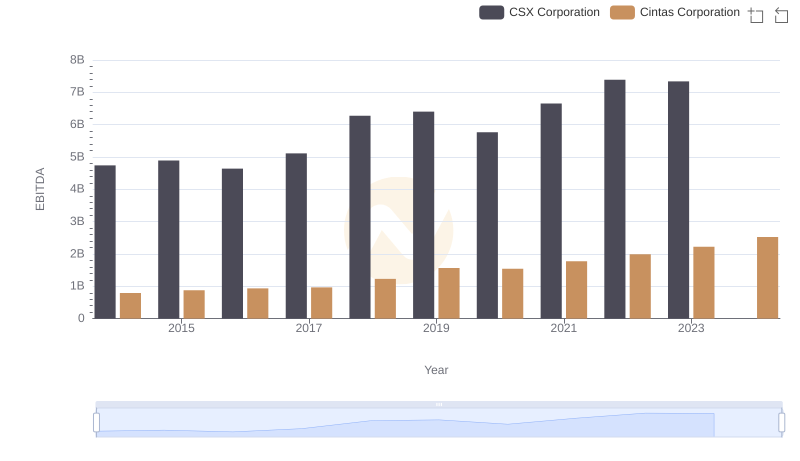
A Side-by-Side Analysis of EBITDA: Cintas Corporation and CSX Corporation