| __timestamp | Allegion plc | Watsco, Inc. |
|---|---|---|
| Wednesday, January 1, 2014 | 365700000 | 323674000 |
| Thursday, January 1, 2015 | 315400000 | 355865000 |
| Friday, January 1, 2016 | 422600000 | 365698000 |
| Sunday, January 1, 2017 | 523300000 | 375907000 |
| Monday, January 1, 2018 | 617600000 | 394177000 |
| Tuesday, January 1, 2019 | 614300000 | 391396000 |
| Wednesday, January 1, 2020 | 497700000 | 426942000 |
| Friday, January 1, 2021 | 657300000 | 656655000 |
| Saturday, January 1, 2022 | 688300000 | 863261000 |
| Sunday, January 1, 2023 | 819300000 | 829900000 |
| Monday, January 1, 2024 | 919800000 | 781775000 |
Infusing magic into the data realm
In the ever-evolving landscape of industrial giants, Watsco, Inc. and Allegion plc have emerged as formidable players. Over the past decade, these companies have demonstrated remarkable EBITDA growth, reflecting their strategic prowess and market adaptability.
From 2014 to 2023, Allegion plc's EBITDA surged by approximately 124%, showcasing its robust operational efficiency and market expansion. Meanwhile, Watsco, Inc. experienced an impressive 156% increase, underscoring its stronghold in the HVAC distribution sector. Notably, 2022 marked a pivotal year for Watsco, Inc., as it surpassed Allegion plc in EBITDA, achieving a record high of $863 million.
This financial trajectory highlights the resilience and strategic foresight of both companies. As they continue to innovate and expand, stakeholders and investors alike are keenly observing their next moves in this competitive arena.
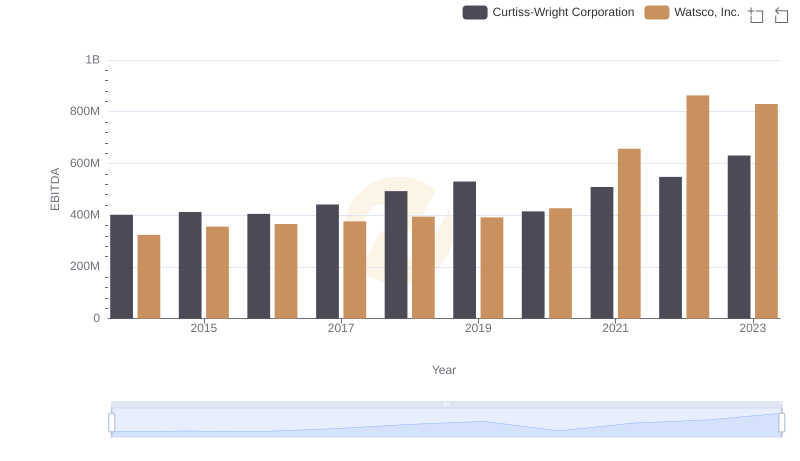
EBITDA Analysis: Evaluating Watsco, Inc. Against Curtiss-Wright Corporation
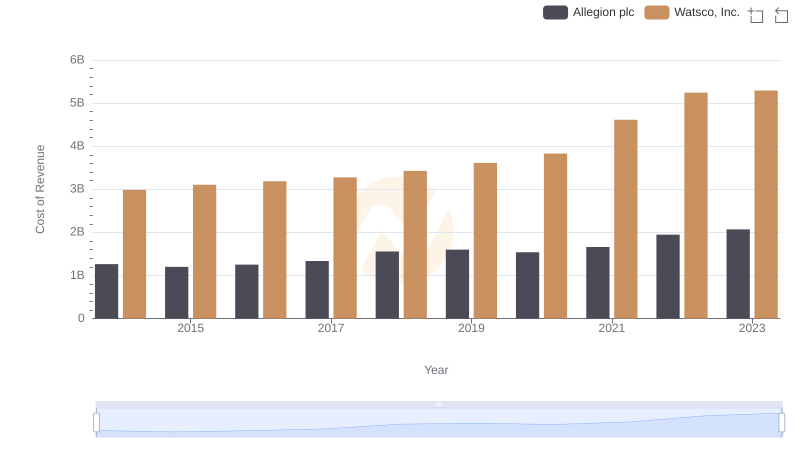
Comparing Cost of Revenue Efficiency: Watsco, Inc. vs Allegion plc
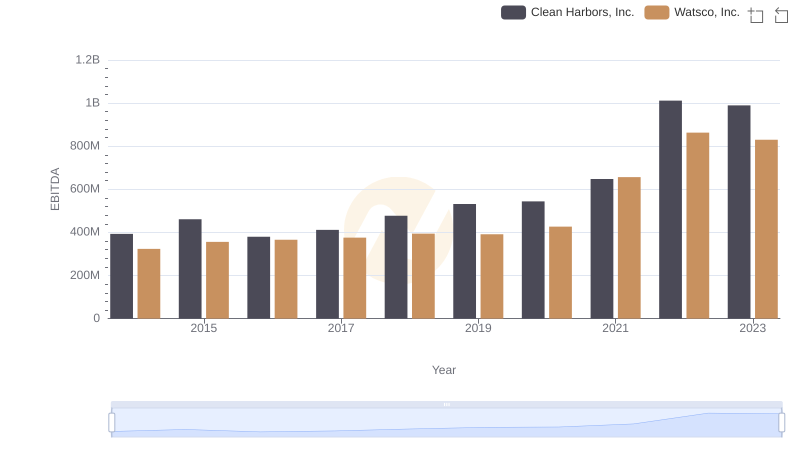
A Side-by-Side Analysis of EBITDA: Watsco, Inc. and Clean Harbors, Inc.
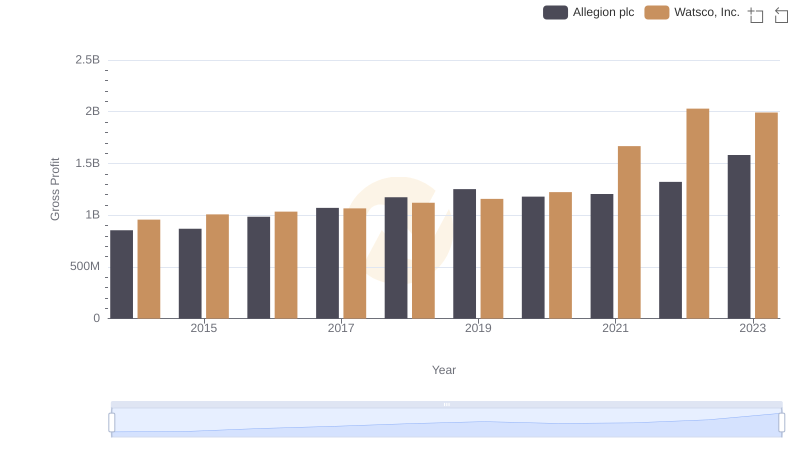
Who Generates Higher Gross Profit? Watsco, Inc. or Allegion plc
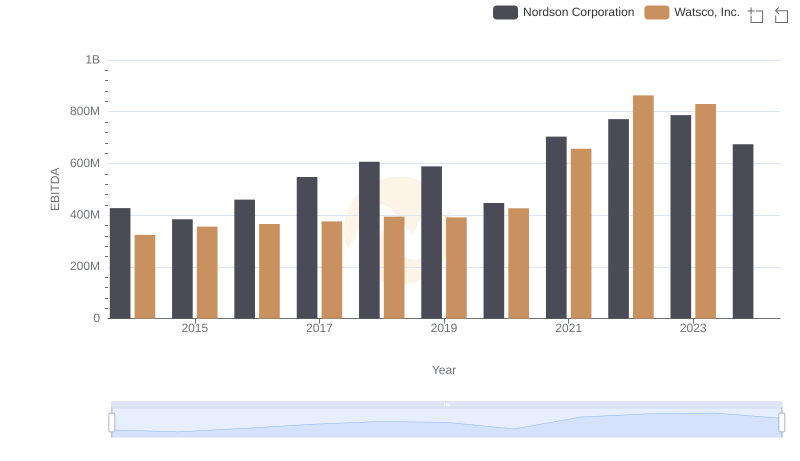
A Side-by-Side Analysis of EBITDA: Watsco, Inc. and Nordson Corporation
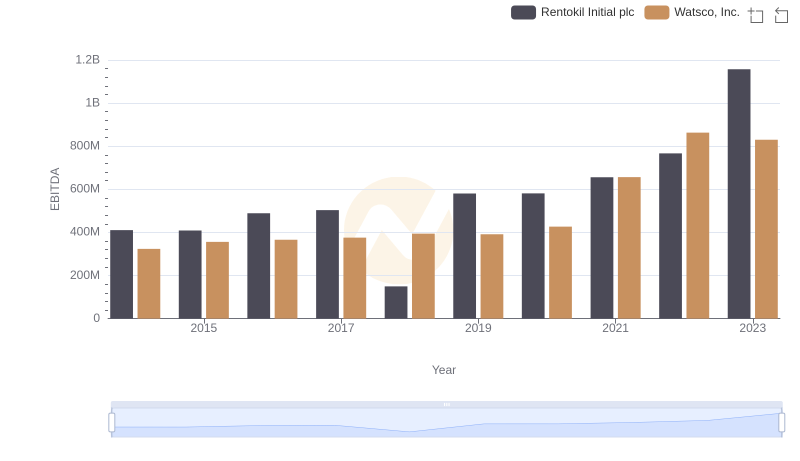
A Side-by-Side Analysis of EBITDA: Watsco, Inc. and Rentokil Initial plc
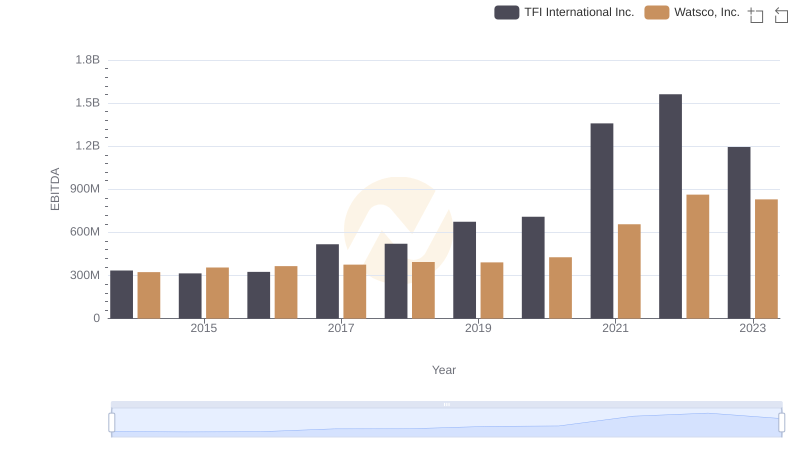
Watsco, Inc. vs TFI International Inc.: In-Depth EBITDA Performance Comparison