| __timestamp | EMCOR Group, Inc. | Ingersoll Rand Inc. |
|---|---|---|
| Wednesday, January 1, 2014 | 907246000 | 936781000 |
| Thursday, January 1, 2015 | 944479000 | 779100000 |
| Friday, January 1, 2016 | 1037862000 | 716731000 |
| Sunday, January 1, 2017 | 1147012000 | 897900000 |
| Monday, January 1, 2018 | 1205453000 | 1012500000 |
| Tuesday, January 1, 2019 | 1355868000 | 911700000 |
| Wednesday, January 1, 2020 | 1395382000 | 1613400000 |
| Friday, January 1, 2021 | 1501737000 | 1988500000 |
| Saturday, January 1, 2022 | 1603594000 | 2325600000 |
| Sunday, January 1, 2023 | 2089339000 | 2882200000 |
| Monday, January 1, 2024 | 0 |
Unleashing the power of data
In the ever-evolving landscape of industrial and construction services, two giants have emerged with impressive growth trajectories over the past decade. Ingersoll Rand Inc. and EMCOR Group, Inc. have both demonstrated robust financial health, as evidenced by their gross profit trends from 2014 to 2023.
Ingersoll Rand Inc.: Starting with a gross profit of approximately $937 million in 2014, Ingersoll Rand has seen a remarkable increase of over 200% by 2023, reaching nearly $2.9 billion. This growth underscores the company's strategic expansions and operational efficiencies.
EMCOR Group, Inc.: Not to be outdone, EMCOR Group began with a gross profit of around $907 million in 2014 and achieved a 130% increase, culminating in over $2 billion by 2023. This steady rise highlights EMCOR's resilience and adaptability in a competitive market.
Both companies have shown resilience and adaptability, with Ingersoll Rand taking a slight lead in recent years. As we look to the future, these trends suggest continued growth and innovation in the industrial sector.
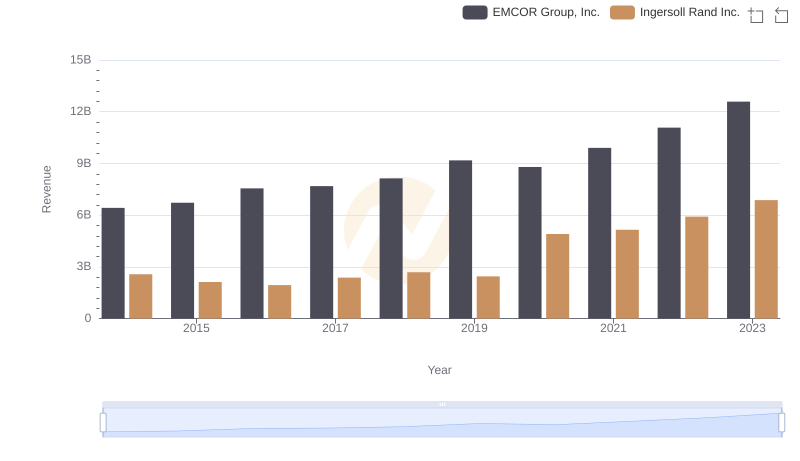
Breaking Down Revenue Trends: Ingersoll Rand Inc. vs EMCOR Group, Inc.
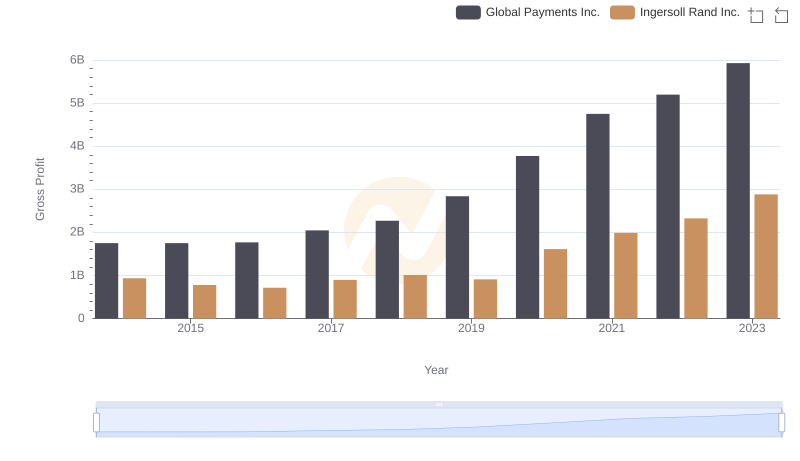
Who Generates Higher Gross Profit? Ingersoll Rand Inc. or Global Payments Inc.
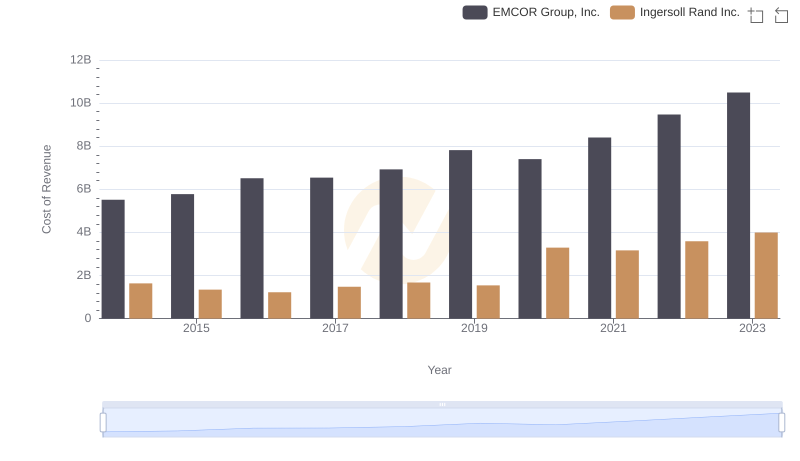
Comparing Cost of Revenue Efficiency: Ingersoll Rand Inc. vs EMCOR Group, Inc.
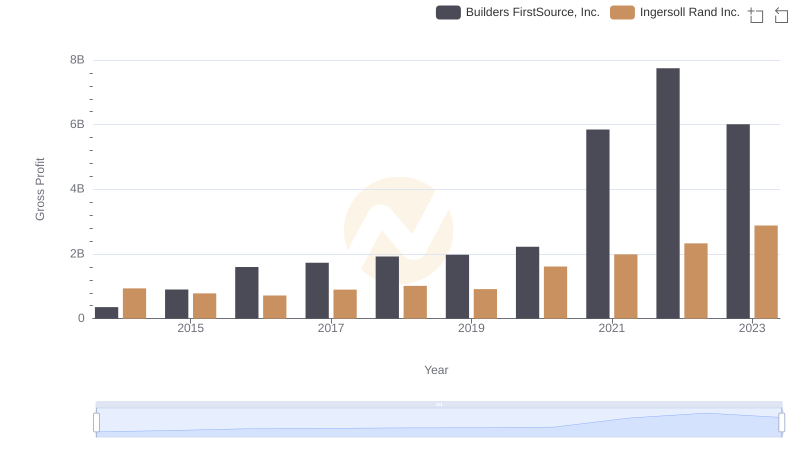
Gross Profit Analysis: Comparing Ingersoll Rand Inc. and Builders FirstSource, Inc.
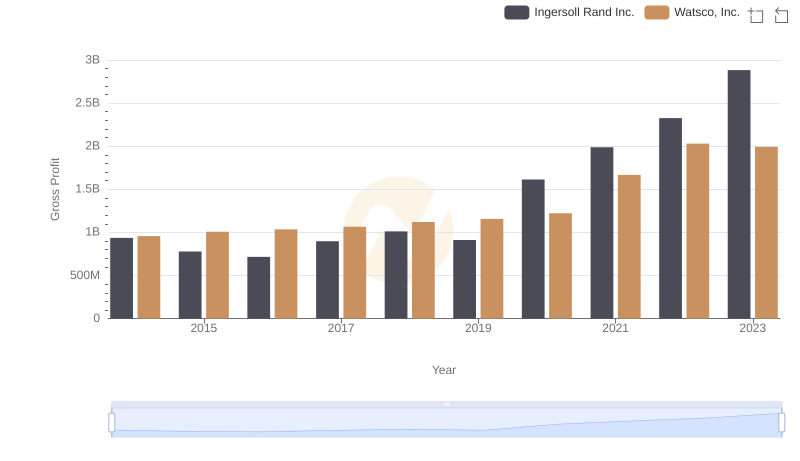
Gross Profit Comparison: Ingersoll Rand Inc. and Watsco, Inc. Trends
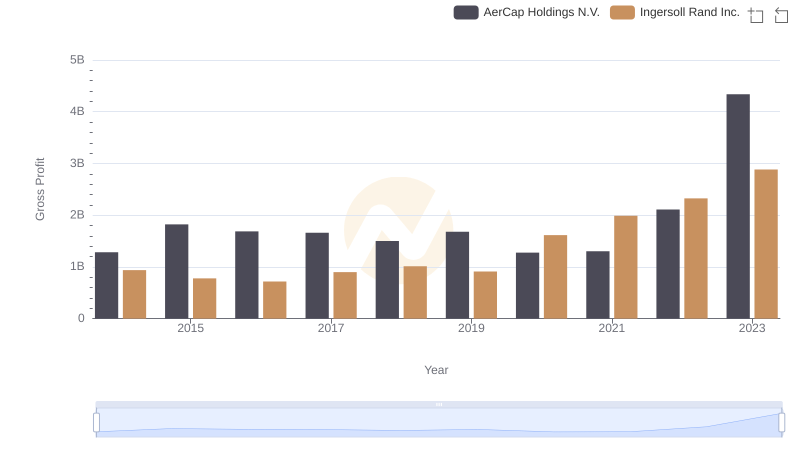
Gross Profit Comparison: Ingersoll Rand Inc. and AerCap Holdings N.V. Trends
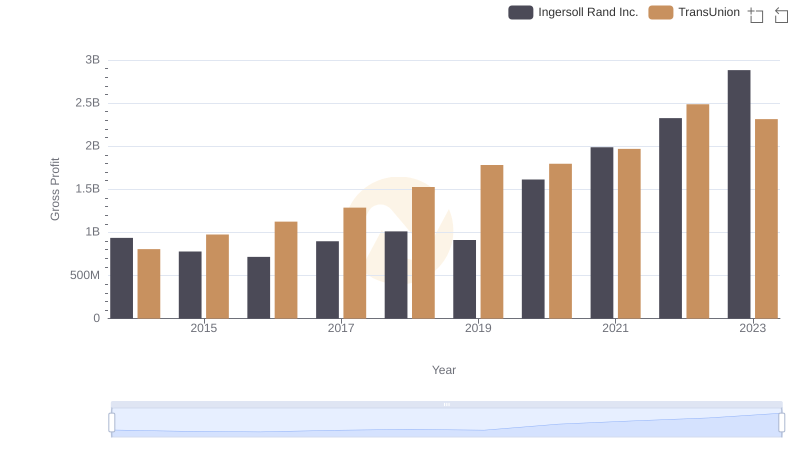
Ingersoll Rand Inc. and TransUnion: A Detailed Gross Profit Analysis