| __timestamp | Clean Harbors, Inc. | Equifax Inc. |
|---|---|---|
| Wednesday, January 1, 2014 | 2441796000 | 844700000 |
| Thursday, January 1, 2015 | 2356806000 | 887400000 |
| Friday, January 1, 2016 | 1932857000 | 1113400000 |
| Sunday, January 1, 2017 | 2062673000 | 1210700000 |
| Monday, January 1, 2018 | 2305551000 | 1440400000 |
| Tuesday, January 1, 2019 | 2387819000 | 1521700000 |
| Wednesday, January 1, 2020 | 2137751000 | 1737400000 |
| Friday, January 1, 2021 | 2609837000 | 1980900000 |
| Saturday, January 1, 2022 | 3543930000 | 2177200000 |
| Sunday, January 1, 2023 | 3746124000 | 2335100000 |
| Monday, January 1, 2024 | 4065713000 | 0 |
Unveiling the hidden dimensions of data
In the ever-evolving landscape of corporate finance, understanding cost efficiency is paramount. This chart offers a fascinating glimpse into the cost of revenue trends for Equifax Inc. and Clean Harbors, Inc. over the past decade. From 2014 to 2023, Clean Harbors, Inc. consistently outpaced Equifax Inc. in terms of cost of revenue, with a notable increase of approximately 54% from 2014 to 2023. In contrast, Equifax Inc. saw a more modest rise of around 176% during the same period.
Clean Harbors, Inc. demonstrated a robust growth trajectory, particularly in the last two years, with a significant surge in 2022 and 2023. Equifax Inc., while maintaining steady growth, showed a more gradual increase. This data underscores the importance of strategic cost management in maintaining competitive advantage. As businesses navigate the complexities of the modern economy, these insights provide valuable lessons in financial stewardship.
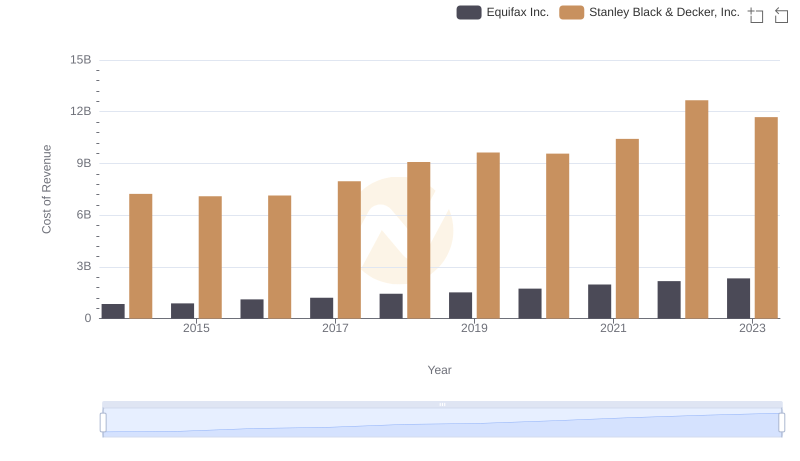
Cost of Revenue Trends: Equifax Inc. vs Stanley Black & Decker, Inc.
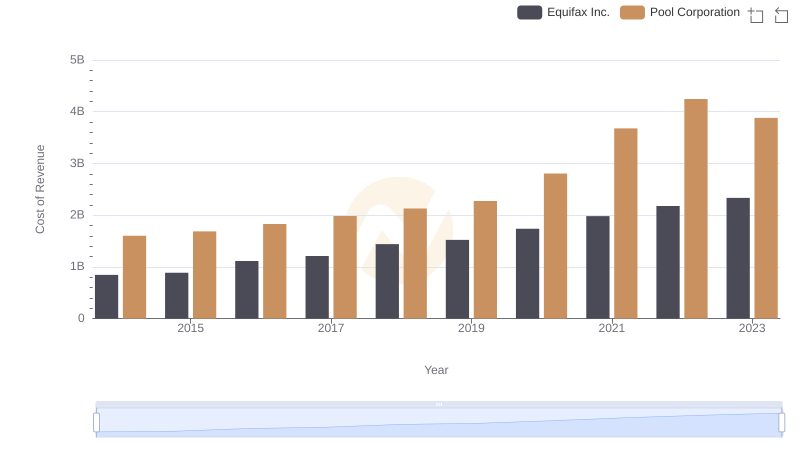
Cost of Revenue Comparison: Equifax Inc. vs Pool Corporation
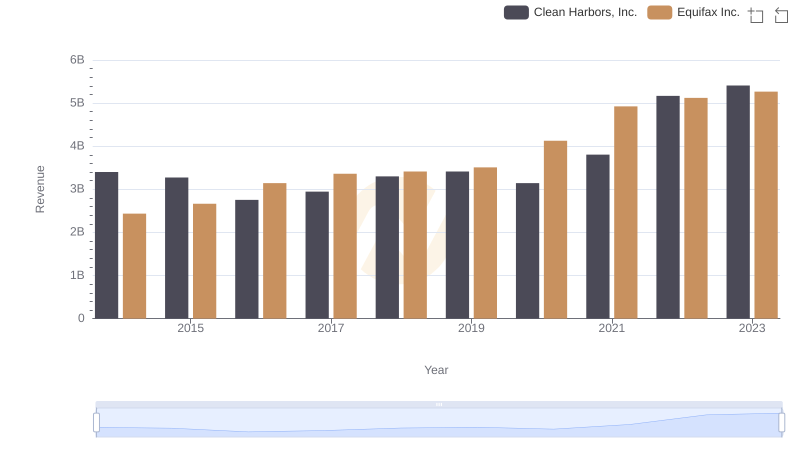
Comparing Revenue Performance: Equifax Inc. or Clean Harbors, Inc.?
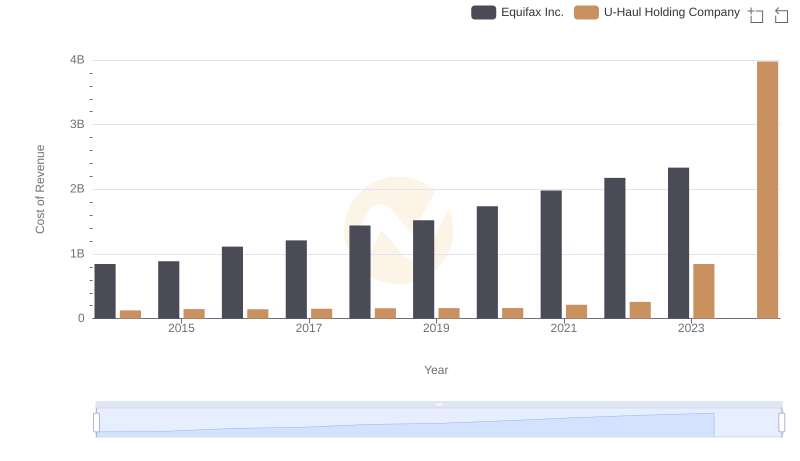
Cost of Revenue Comparison: Equifax Inc. vs U-Haul Holding Company
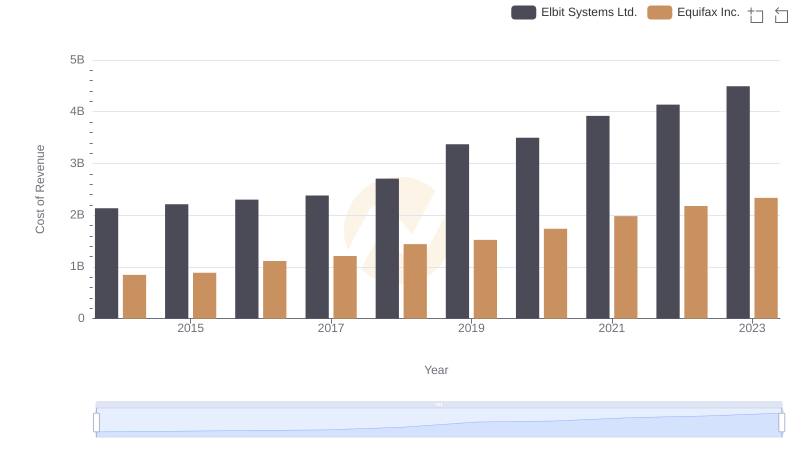
Cost of Revenue Comparison: Equifax Inc. vs Elbit Systems Ltd.
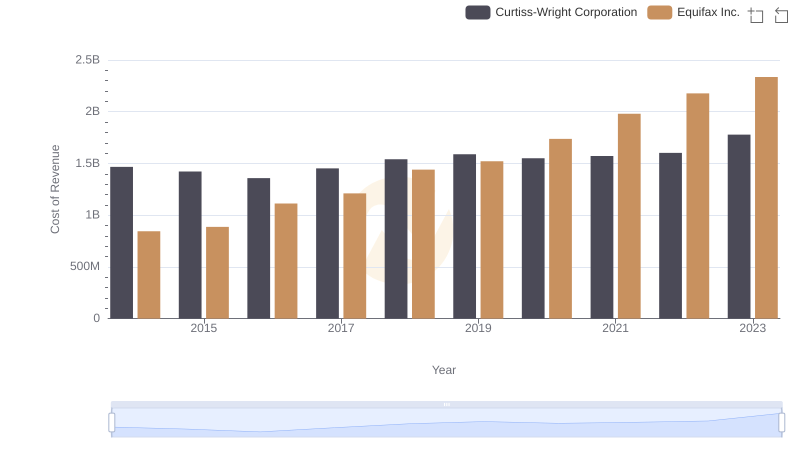
Cost of Revenue Trends: Equifax Inc. vs Curtiss-Wright Corporation
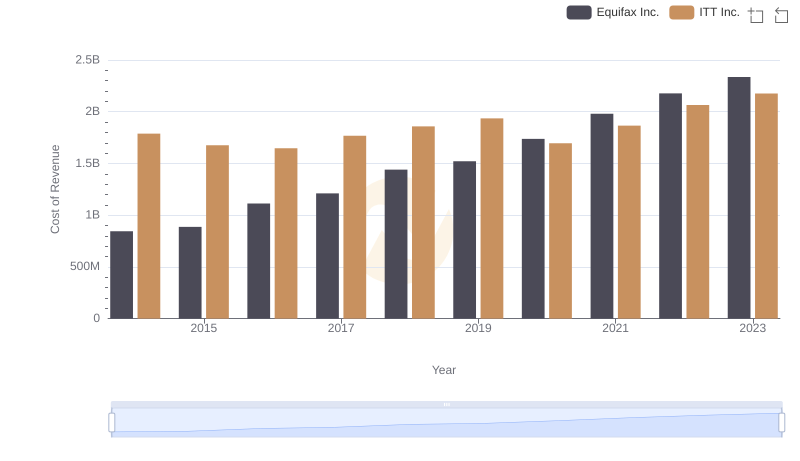
Analyzing Cost of Revenue: Equifax Inc. and ITT Inc.