| __timestamp | Clean Harbors, Inc. | Equifax Inc. |
|---|---|---|
| Wednesday, January 1, 2014 | 3401636000 | 2436400000 |
| Thursday, January 1, 2015 | 3275137000 | 2663600000 |
| Friday, January 1, 2016 | 2755226000 | 3144900000 |
| Sunday, January 1, 2017 | 2944978000 | 3362200000 |
| Monday, January 1, 2018 | 3300303000 | 3412100000 |
| Tuesday, January 1, 2019 | 3412190000 | 3507600000 |
| Wednesday, January 1, 2020 | 3144097000 | 4127500000 |
| Friday, January 1, 2021 | 3805566000 | 4923900000 |
| Saturday, January 1, 2022 | 5166605000 | 5122200000 |
| Sunday, January 1, 2023 | 5409152000 | 5265200000 |
| Monday, January 1, 2024 | 5889952000 | 5681100000 |
Cracking the code
In the ever-evolving landscape of corporate America, revenue growth is a key indicator of a company's success. This chart provides a fascinating glimpse into the revenue trajectories of Equifax Inc. and Clean Harbors, Inc. over the past decade. From 2014 to 2023, Equifax Inc. has seen a remarkable revenue increase of over 116%, peaking at approximately $5.27 billion in 2023. Meanwhile, Clean Harbors, Inc. has experienced an impressive growth of around 59%, reaching about $5.41 billion in the same year. Notably, Clean Harbors surpassed Equifax in revenue in 2022, marking a significant shift in the competitive landscape. This data underscores the dynamic nature of the market and highlights the strategic maneuvers these companies have undertaken to bolster their financial standings. As we look to the future, the question remains: which company will continue to lead the revenue race?
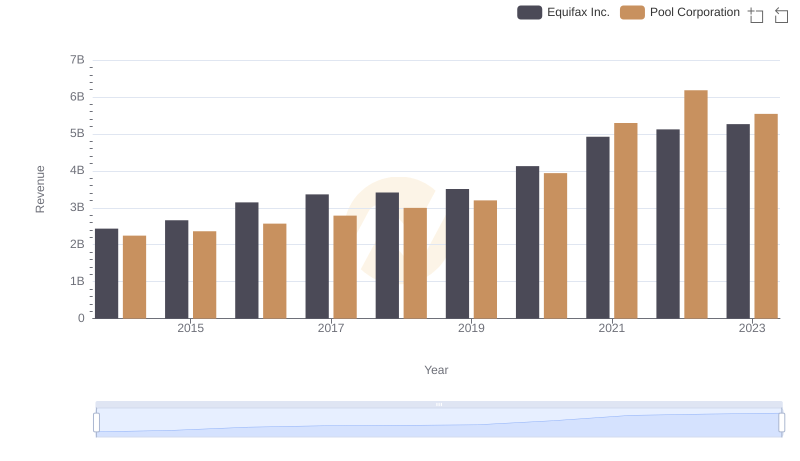
Comparing Revenue Performance: Equifax Inc. or Pool Corporation?
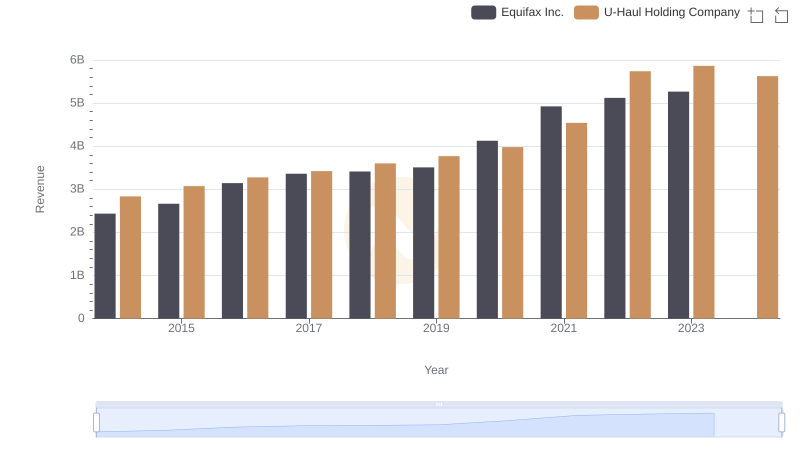
Equifax Inc. or U-Haul Holding Company: Who Leads in Yearly Revenue?
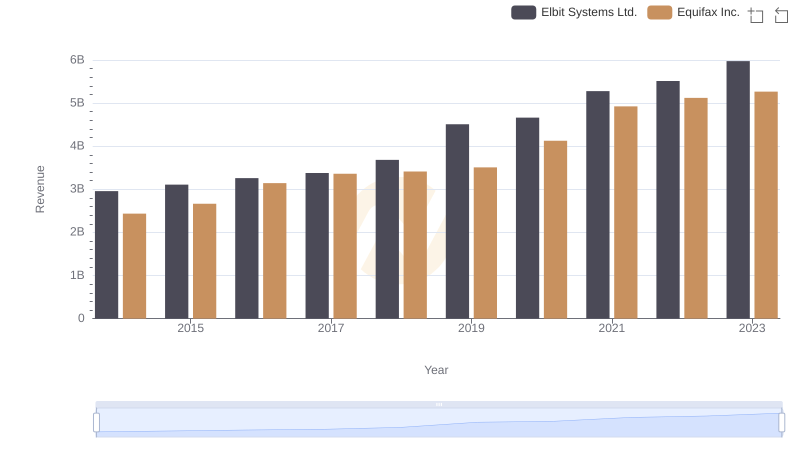
Equifax Inc. or Elbit Systems Ltd.: Who Leads in Yearly Revenue?
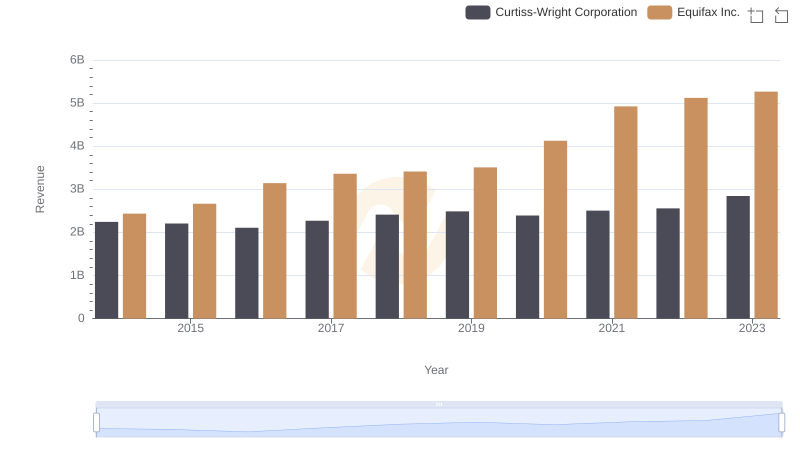
Breaking Down Revenue Trends: Equifax Inc. vs Curtiss-Wright Corporation
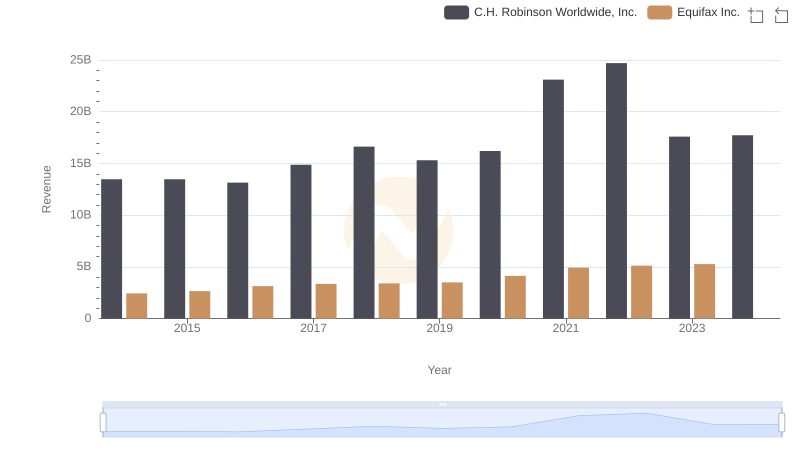
Annual Revenue Comparison: Equifax Inc. vs C.H. Robinson Worldwide, Inc.
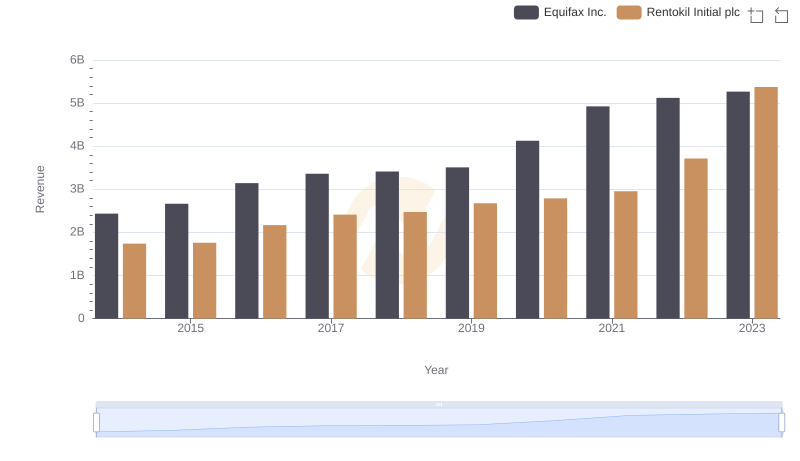
Equifax Inc. or Rentokil Initial plc: Who Leads in Yearly Revenue?
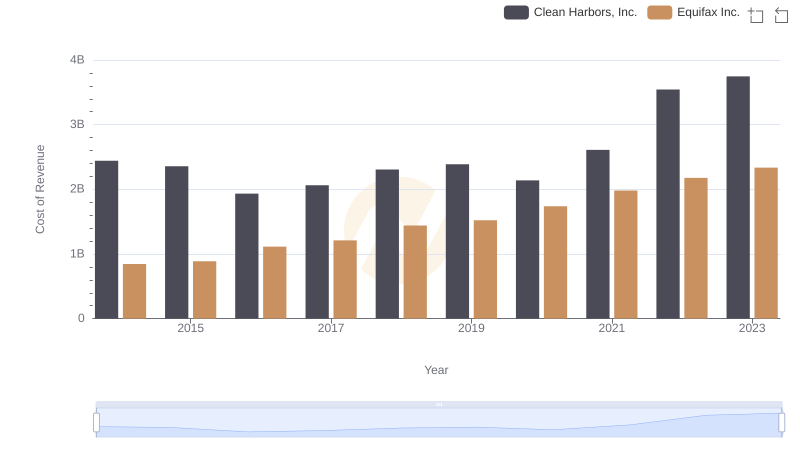
Comparing Cost of Revenue Efficiency: Equifax Inc. vs Clean Harbors, Inc.