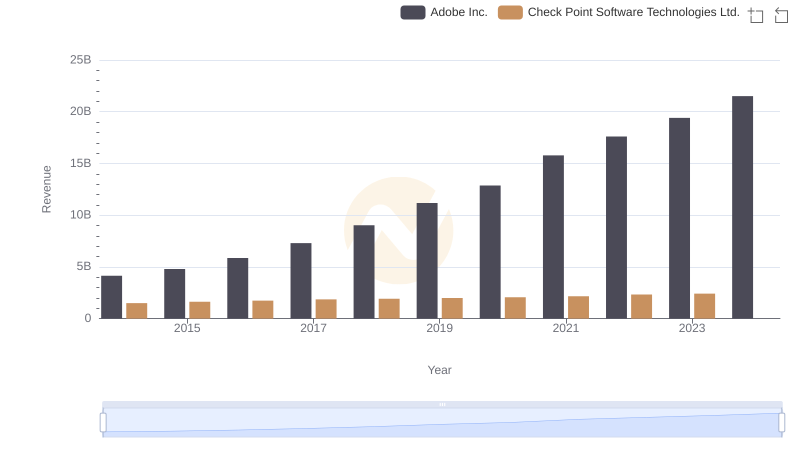
| __timestamp | Adobe Inc. | Check Point Software Technologies Ltd. |
|---|---|---|
| Wednesday, January 1, 2014 | 622080000 | 176541000 |
| Thursday, January 1, 2015 | 744317000 | 189057000 |
| Friday, January 1, 2016 | 819908000 | 202003000 |
| Sunday, January 1, 2017 | 1010491000 | 212963000 |
| Monday, January 1, 2018 | 1194999000 | 201379000 |
| Tuesday, January 1, 2019 | 1672720000 | 215400000 |
| Wednesday, January 1, 2020 | 1722000000 | 226500000 |
| Friday, January 1, 2021 | 1865000000 | 258100000 |
| Saturday, January 1, 2022 | 2165000000 | 304400000 |
| Sunday, January 1, 2023 | 2354000000 | 282600000 |
| Monday, January 1, 2024 | 2358000000 |
Igniting the spark of knowledge
In the ever-evolving tech landscape, understanding cost structures is crucial for investors and analysts. Adobe Inc. and Check Point Software Technologies Ltd. offer a fascinating study in contrasts. Over the past decade, Adobe's cost of revenue has surged by approximately 280%, reflecting its aggressive growth and expansion strategies. In 2014, Adobe's cost of revenue was around 620 million, but by 2023, it had climbed to nearly 2.35 billion. This increase underscores Adobe's commitment to innovation and market leadership.
Conversely, Check Point Software Technologies Ltd. has maintained a more stable cost structure, with a modest increase of about 60% over the same period. Starting at roughly 177 million in 2014, it peaked at 304 million in 2022. This stability highlights Check Point's focus on efficiency and consistent performance. Notably, data for 2024 is missing, leaving room for speculation on future trends.
Adobe Inc. and Check Point Software Technologies Ltd.: A Comprehensive Revenue Analysis
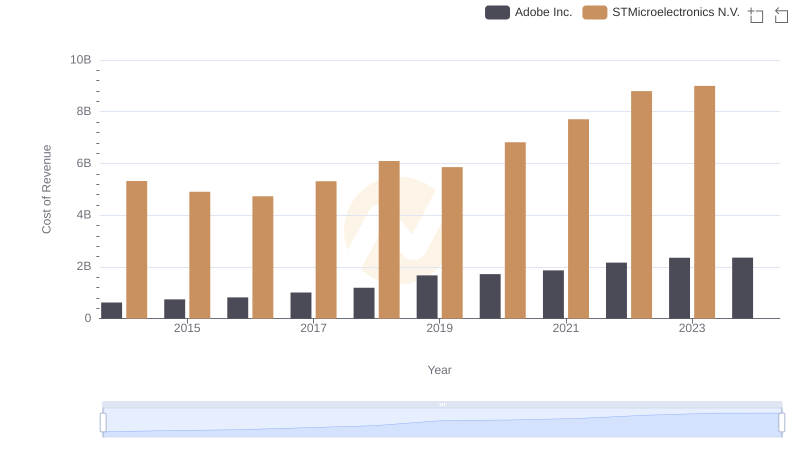
Adobe Inc. vs STMicroelectronics N.V.: Efficiency in Cost of Revenue Explored
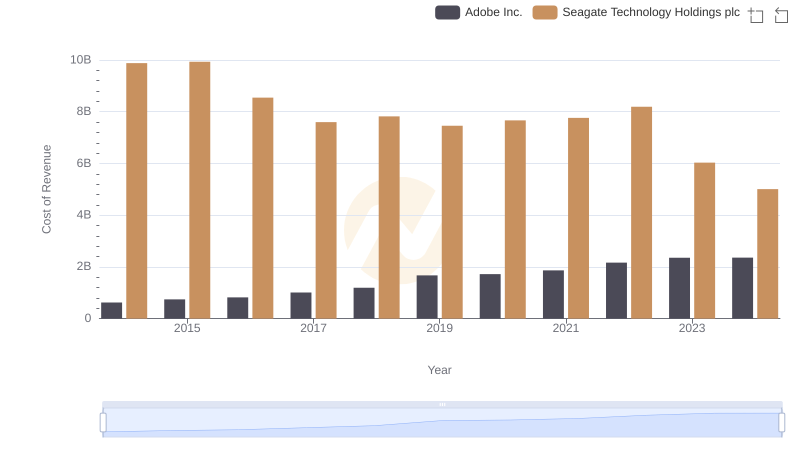
Cost of Revenue: Key Insights for Adobe Inc. and Seagate Technology Holdings plc
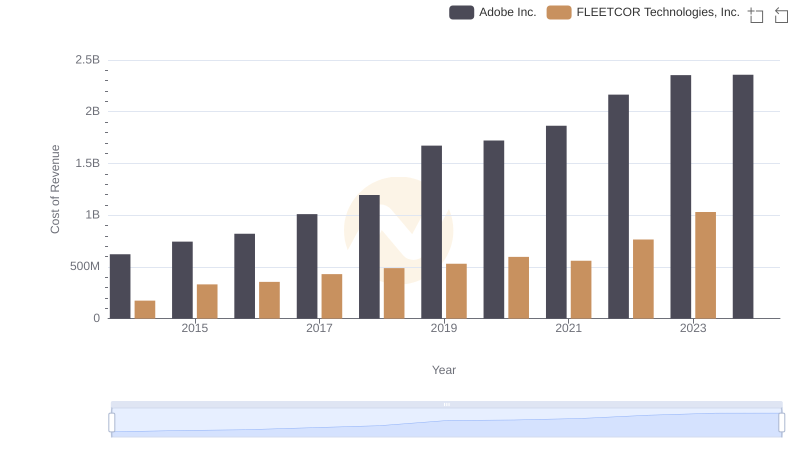
Adobe Inc. vs FLEETCOR Technologies, Inc.: Efficiency in Cost of Revenue Explored
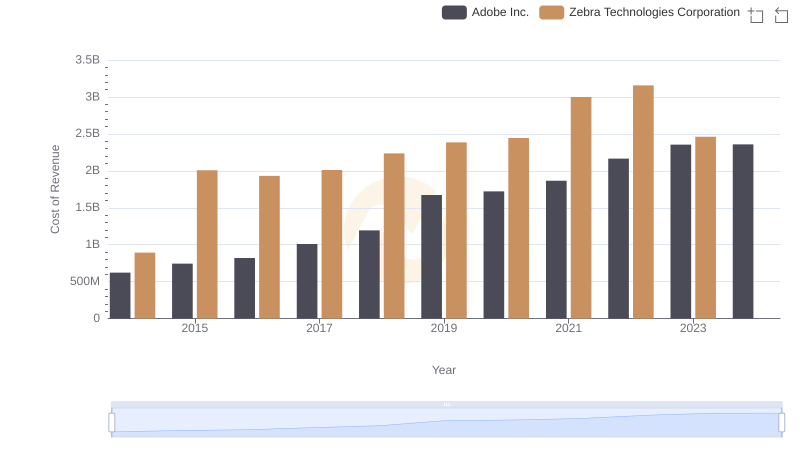
Comparing Cost of Revenue Efficiency: Adobe Inc. vs Zebra Technologies Corporation
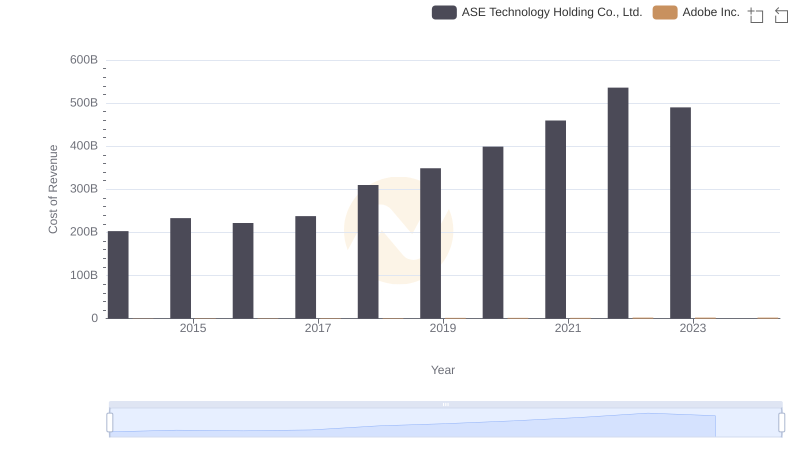
Comparing Cost of Revenue Efficiency: Adobe Inc. vs ASE Technology Holding Co., Ltd.

Cost Insights: Breaking Down Adobe Inc. and Pure Storage, Inc.'s Expenses

Adobe Inc. vs Check Point Software Technologies Ltd.: A Gross Profit Performance Breakdown
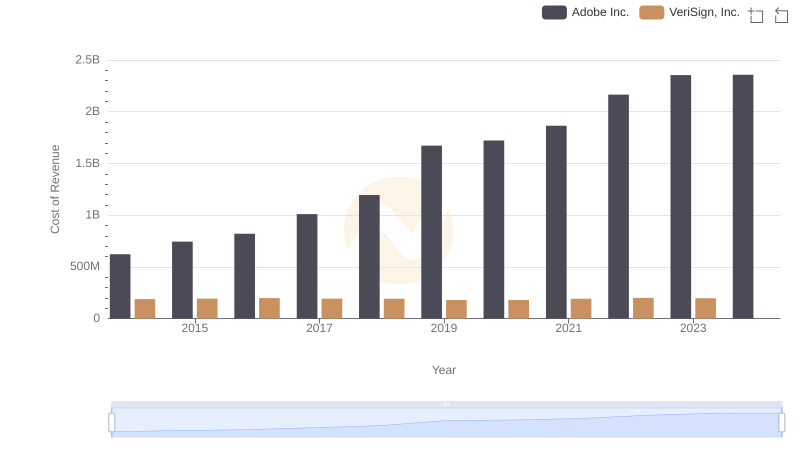
Cost Insights: Breaking Down Adobe Inc. and VeriSign, Inc.'s Expenses
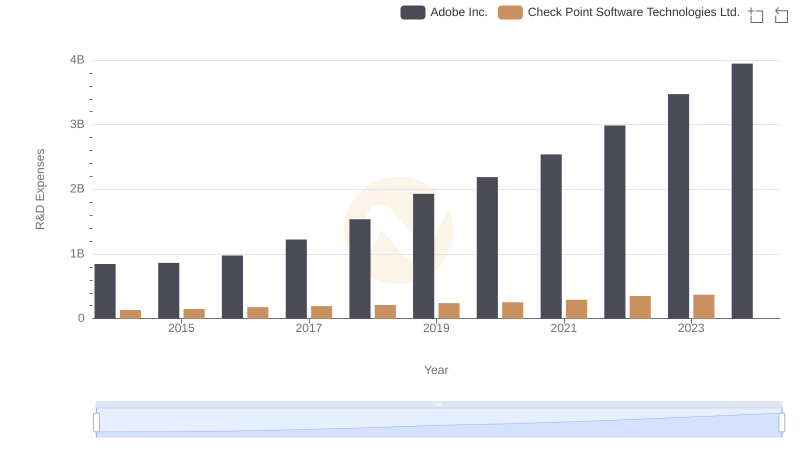
Research and Development Expenses Breakdown: Adobe Inc. vs Check Point Software Technologies Ltd.
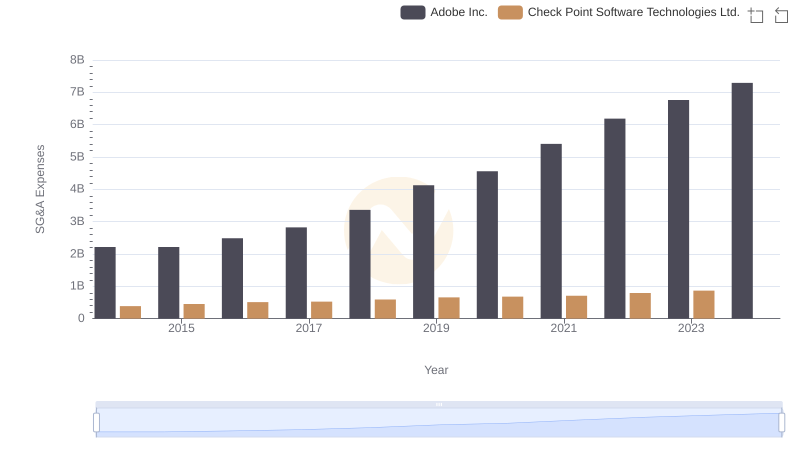
Adobe Inc. and Check Point Software Technologies Ltd.: SG&A Spending Patterns Compared
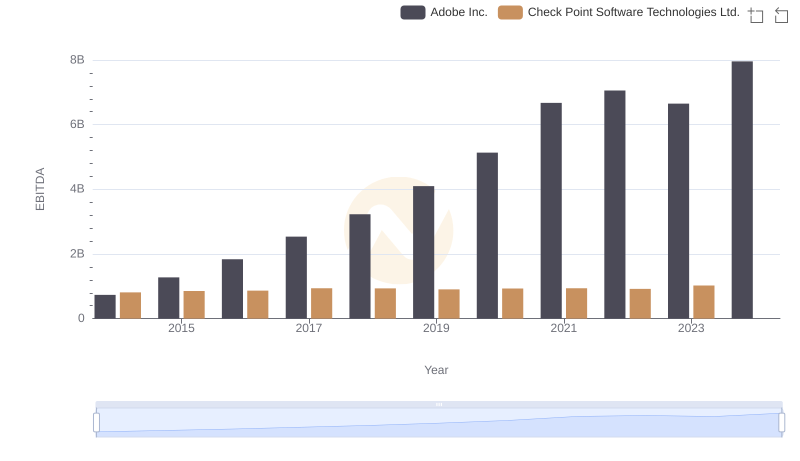
EBITDA Performance Review: Adobe Inc. vs Check Point Software Technologies Ltd.