| __timestamp | Rockwell Automation, Inc. | Westinghouse Air Brake Technologies Corporation |
|---|---|---|
| Wednesday, January 1, 2014 | 1346000000 | 588370000 |
| Thursday, January 1, 2015 | 1359100000 | 672301000 |
| Friday, January 1, 2016 | 1200700000 | 535893000 |
| Sunday, January 1, 2017 | 1258400000 | 532795000 |
| Monday, January 1, 2018 | 1568400000 | 584199000 |
| Tuesday, January 1, 2019 | 1150200000 | 1067300000 |
| Wednesday, January 1, 2020 | 1410200000 | 1229400000 |
| Friday, January 1, 2021 | 1808300000 | 1405000000 |
| Saturday, January 1, 2022 | 1432100000 | 1519000000 |
| Sunday, January 1, 2023 | 1990700000 | 1787000000 |
| Monday, January 1, 2024 | 1567500000 | 1609000000 |
Unleashing insights
In the ever-evolving landscape of industrial technology, understanding financial performance is crucial. This analysis delves into the EBITDA trends of two industry giants: Westinghouse Air Brake Technologies Corporation and Rockwell Automation, Inc., from 2014 to 2023.
Rockwell Automation has shown a steady EBITDA growth, peaking in 2023 with a 47% increase from its 2014 figures. This consistent upward trajectory highlights its robust market strategies and adaptability. Meanwhile, Westinghouse Air Brake Technologies experienced a remarkable 204% surge in EBITDA from 2014 to 2023, reflecting its aggressive expansion and operational efficiency.
However, 2024 data for Westinghouse is missing, leaving a gap in the analysis. This absence underscores the importance of complete data for accurate financial forecasting. As these companies continue to innovate, their financial health remains a key indicator of their future success.
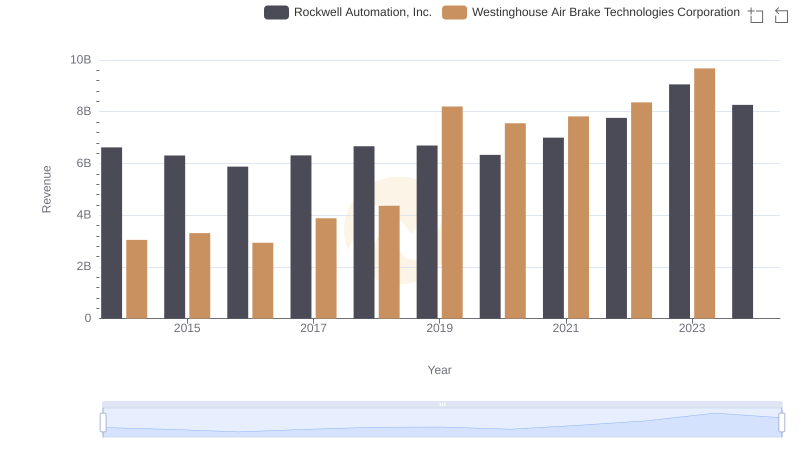
Westinghouse Air Brake Technologies Corporation vs Rockwell Automation, Inc.: Examining Key Revenue Metrics
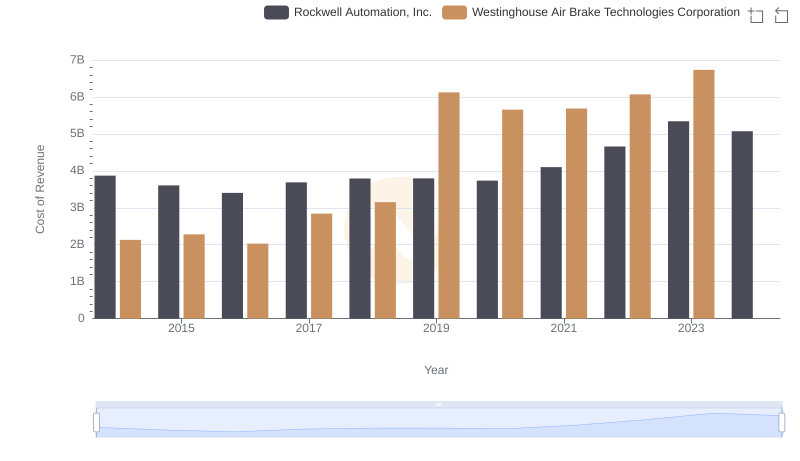
Westinghouse Air Brake Technologies Corporation vs Rockwell Automation, Inc.: Efficiency in Cost of Revenue Explored
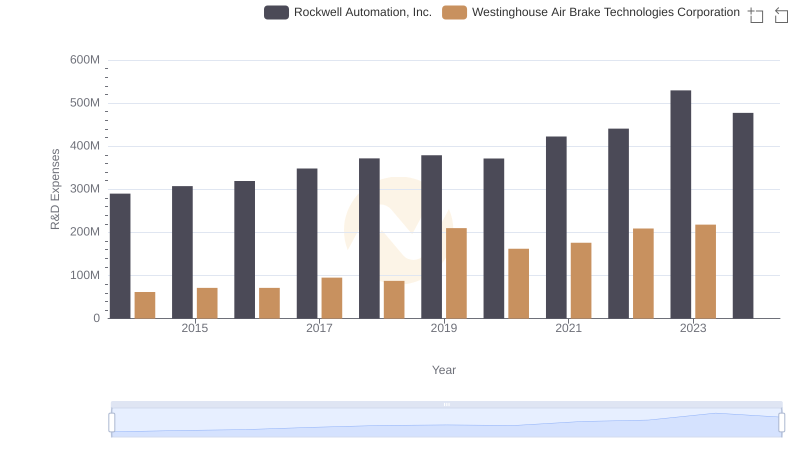
Westinghouse Air Brake Technologies Corporation vs Rockwell Automation, Inc.: Strategic Focus on R&D Spending
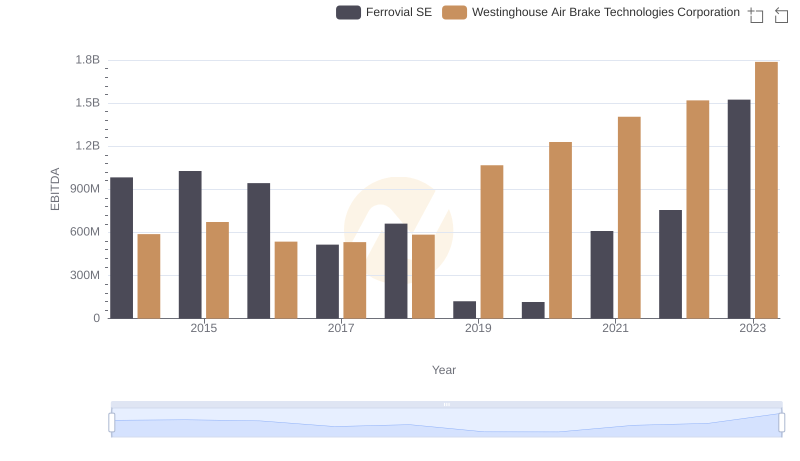
Professional EBITDA Benchmarking: Westinghouse Air Brake Technologies Corporation vs Ferrovial SE
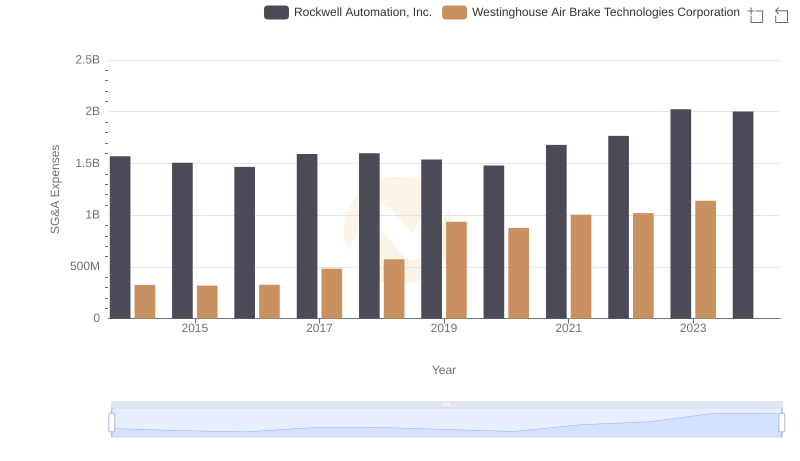
Westinghouse Air Brake Technologies Corporation and Rockwell Automation, Inc.: SG&A Spending Patterns Compared
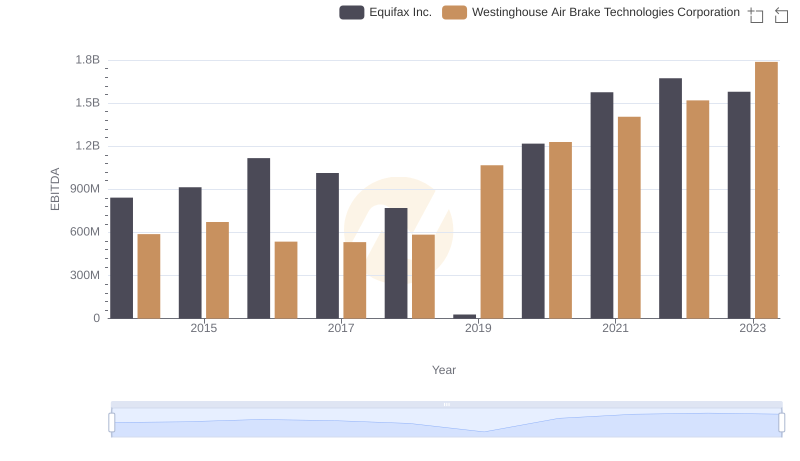
A Side-by-Side Analysis of EBITDA: Westinghouse Air Brake Technologies Corporation and Equifax Inc.
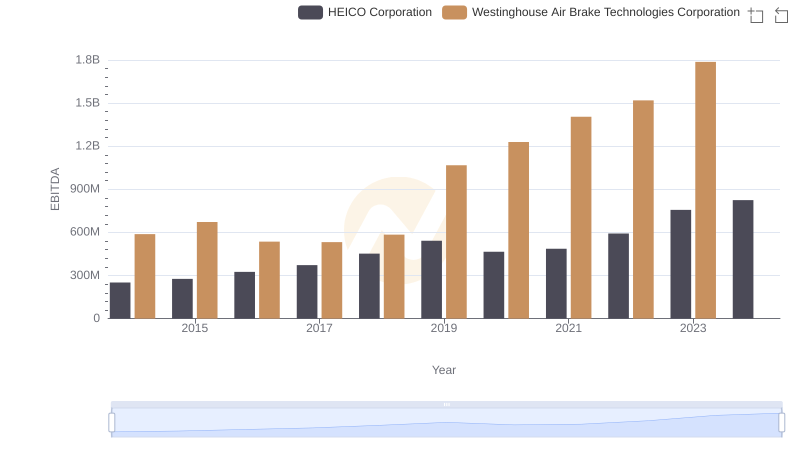
EBITDA Metrics Evaluated: Westinghouse Air Brake Technologies Corporation vs HEICO Corporation
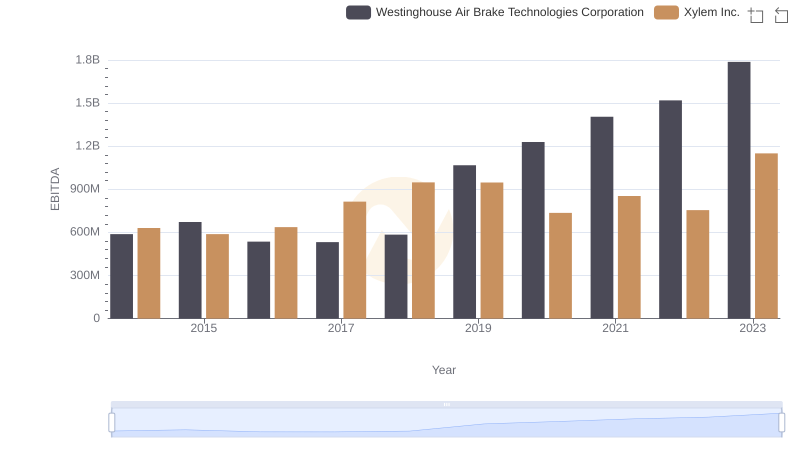
A Professional Review of EBITDA: Westinghouse Air Brake Technologies Corporation Compared to Xylem Inc.

Comparative EBITDA Analysis: Westinghouse Air Brake Technologies Corporation vs Dover Corporation
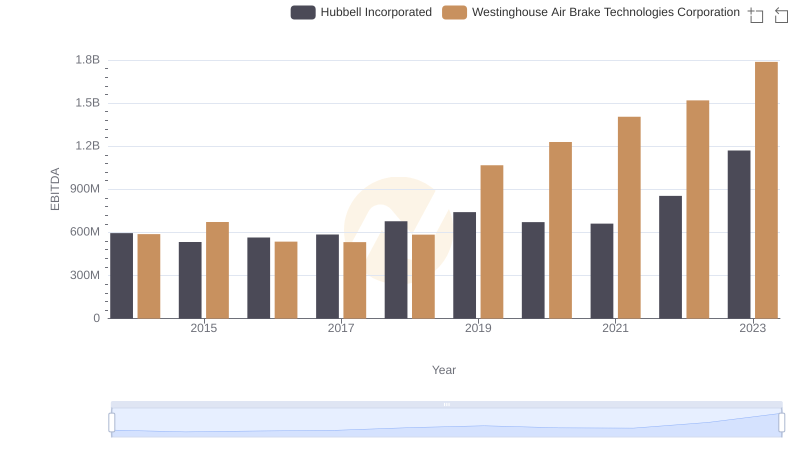
EBITDA Analysis: Evaluating Westinghouse Air Brake Technologies Corporation Against Hubbell Incorporated