| __timestamp | Jacobs Engineering Group Inc. | Waste Management, Inc. |
|---|---|---|
| Wednesday, January 1, 2014 | 10621373000 | 9002000000 |
| Thursday, January 1, 2015 | 10146494000 | 8231000000 |
| Friday, January 1, 2016 | 9196326000 | 8486000000 |
| Sunday, January 1, 2017 | 8250536000 | 9021000000 |
| Monday, January 1, 2018 | 12156276000 | 9249000000 |
| Tuesday, January 1, 2019 | 10260840000 | 9496000000 |
| Wednesday, January 1, 2020 | 10980307000 | 9341000000 |
| Friday, January 1, 2021 | 11048860000 | 11111000000 |
| Saturday, January 1, 2022 | 11595785000 | 12294000000 |
| Sunday, January 1, 2023 | 12879099000 | 12606000000 |
| Monday, January 1, 2024 | 8668185000 | 13383000000 |
Unleashing insights
In the ever-evolving landscape of corporate finance, understanding cost structures is crucial. Waste Management, Inc. and Jacobs Engineering Group Inc. have shown intriguing trends in their cost of revenue from 2014 to 2023. Over this period, Waste Management's cost of revenue increased by approximately 40%, peaking in 2022. Meanwhile, Jacobs Engineering experienced a 21% rise, with a notable spike in 2023. This data highlights the dynamic nature of operational costs in the waste management and engineering sectors. Notably, 2024 data for Waste Management is missing, suggesting potential reporting delays or strategic shifts. These insights are vital for investors and analysts aiming to understand the financial health and strategic direction of these industry leaders. As companies navigate economic challenges, monitoring such financial metrics becomes indispensable for predicting future performance.
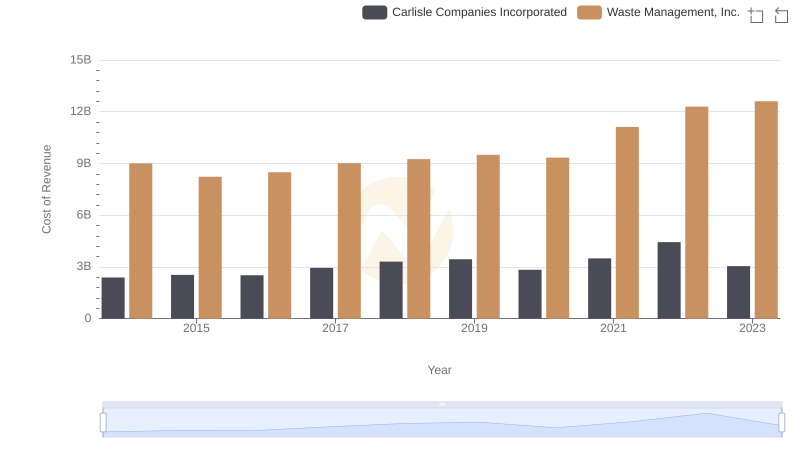
Waste Management, Inc. vs Carlisle Companies Incorporated: Efficiency in Cost of Revenue Explored
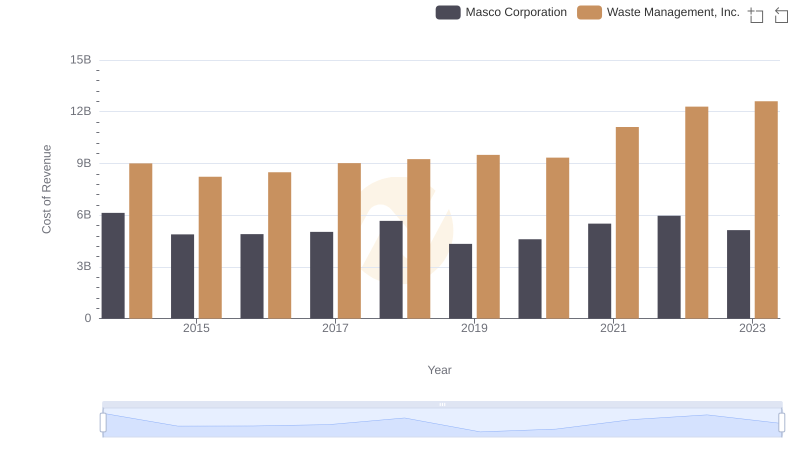
Cost Insights: Breaking Down Waste Management, Inc. and Masco Corporation's Expenses
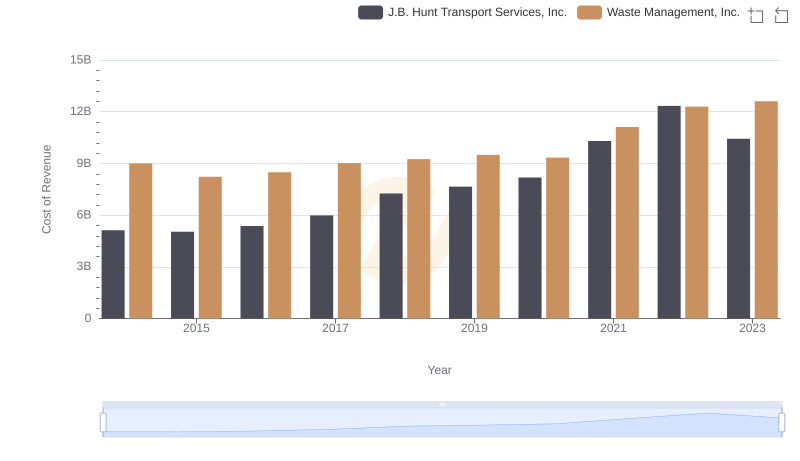
Cost of Revenue Trends: Waste Management, Inc. vs J.B. Hunt Transport Services, Inc.
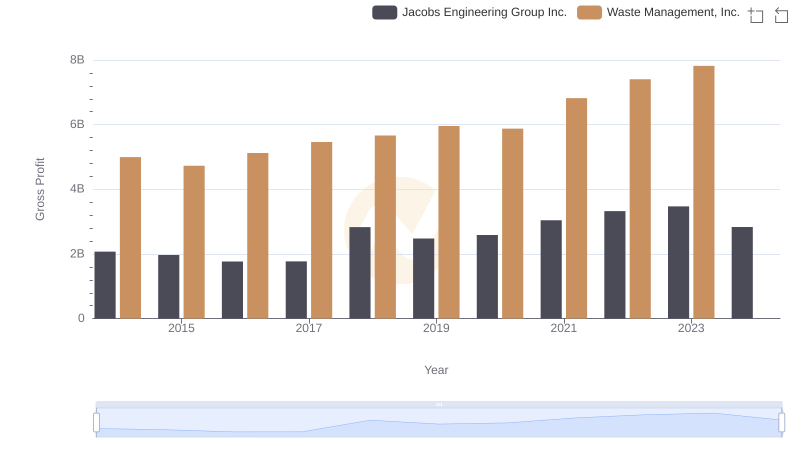
Waste Management, Inc. and Jacobs Engineering Group Inc.: A Detailed Gross Profit Analysis
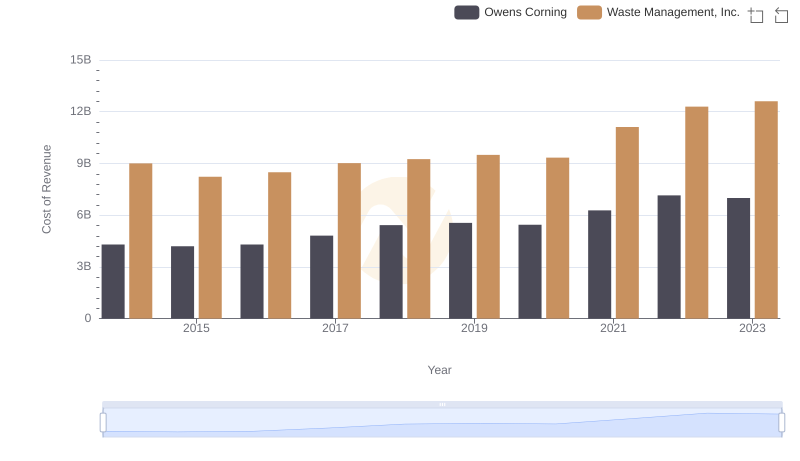
Comparing Cost of Revenue Efficiency: Waste Management, Inc. vs Owens Corning
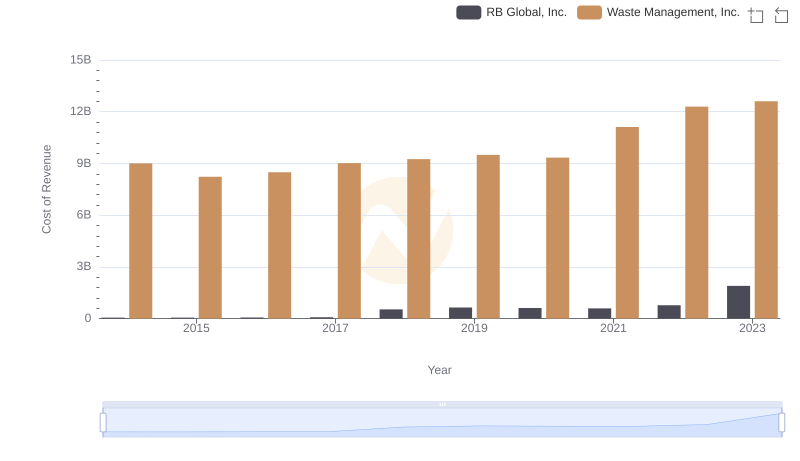
Cost of Revenue: Key Insights for Waste Management, Inc. and RB Global, Inc.
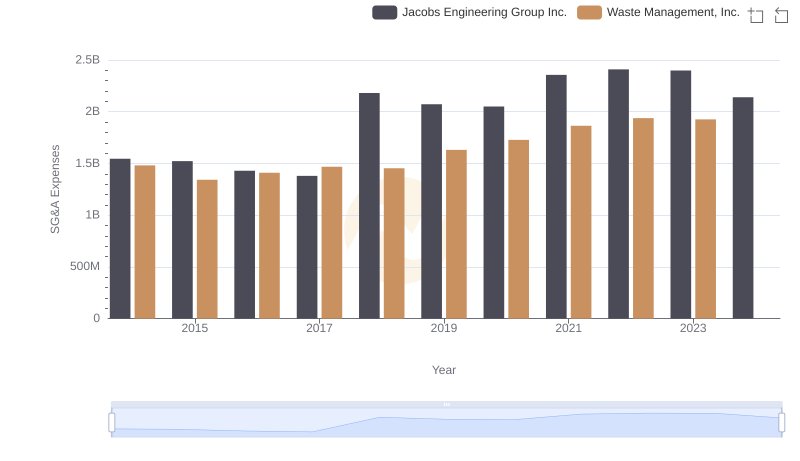
Cost Management Insights: SG&A Expenses for Waste Management, Inc. and Jacobs Engineering Group Inc.
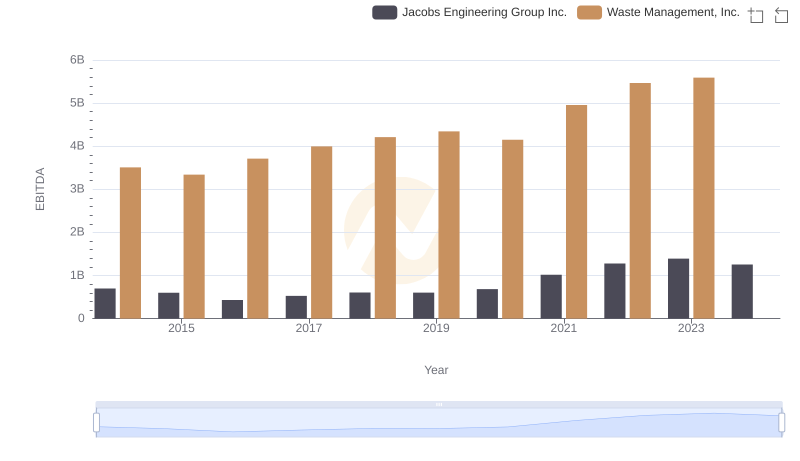
Comparative EBITDA Analysis: Waste Management, Inc. vs Jacobs Engineering Group Inc.