| __timestamp | Cummins Inc. | Trane Technologies plc |
|---|---|---|
| Wednesday, January 1, 2014 | 2498000000 | 1757000000 |
| Thursday, January 1, 2015 | 2604000000 | 1835000000 |
| Friday, January 1, 2016 | 2534000000 | 2311000000 |
| Sunday, January 1, 2017 | 3035000000 | 1982500000 |
| Monday, January 1, 2018 | 3486000000 | 2242400000 |
| Tuesday, January 1, 2019 | 3623000000 | 1931200000 |
| Wednesday, January 1, 2020 | 3125000000 | 1831900000 |
| Friday, January 1, 2021 | 2862000000 | 2319200000 |
| Saturday, January 1, 2022 | 3802000000 | 2715500000 |
| Sunday, January 1, 2023 | 3025000000 | 3149900000 |
| Monday, January 1, 2024 | 6338000000 | 3859600000 |
Igniting the spark of knowledge
In the ever-evolving landscape of industrial giants, Trane Technologies plc and Cummins Inc. have consistently demonstrated their financial prowess. Over the past decade, from 2014 to 2023, these two companies have shown remarkable resilience and growth in their EBITDA figures. Cummins Inc. started the period with an EBITDA of approximately $2.5 billion, peaking at $3.8 billion in 2022, reflecting a robust growth of over 50%. Meanwhile, Trane Technologies plc, which began with an EBITDA of $1.8 billion, saw a significant rise to $3.1 billion by 2023, marking an impressive increase of nearly 80%.
This side-by-side analysis highlights the strategic maneuvers and market adaptations that have propelled these companies forward. As the industrial sector continues to innovate, the financial trajectories of Trane Technologies and Cummins Inc. offer valuable insights into the dynamics of corporate growth and sustainability.
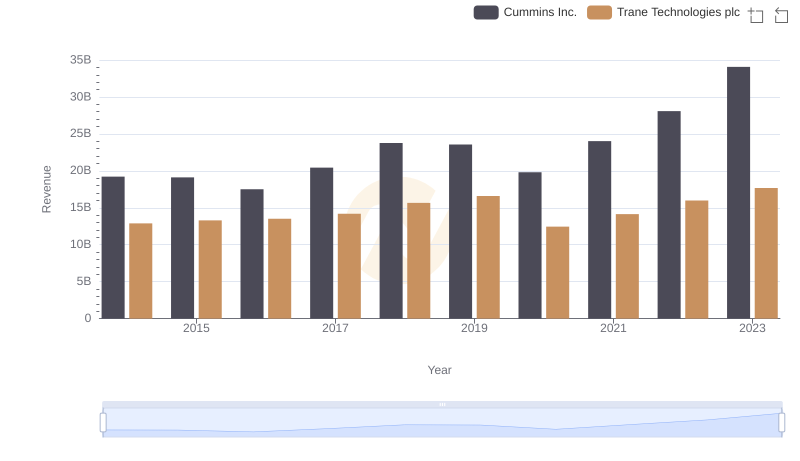
Revenue Showdown: Trane Technologies plc vs Cummins Inc.
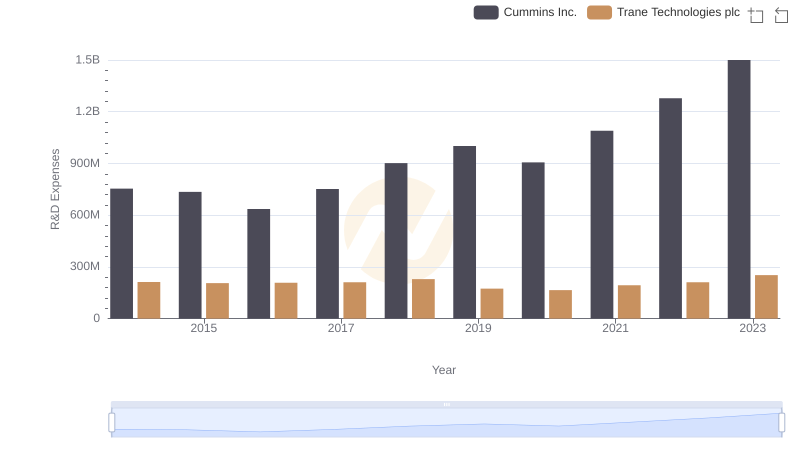
Trane Technologies plc or Cummins Inc.: Who Invests More in Innovation?
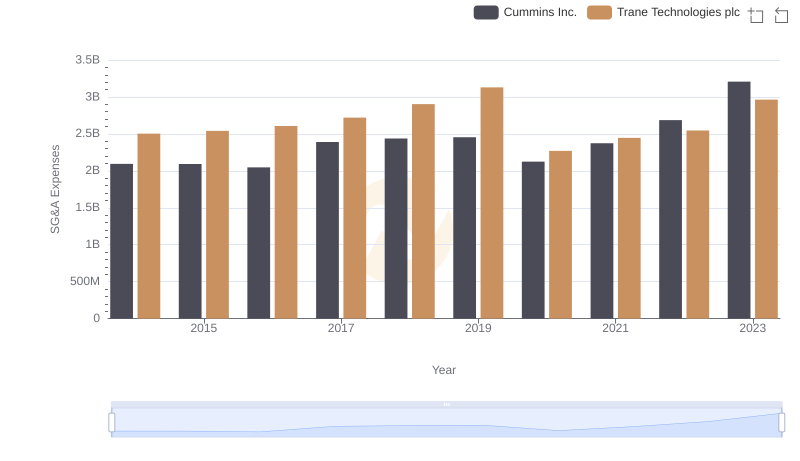
Trane Technologies plc or Cummins Inc.: Who Manages SG&A Costs Better?
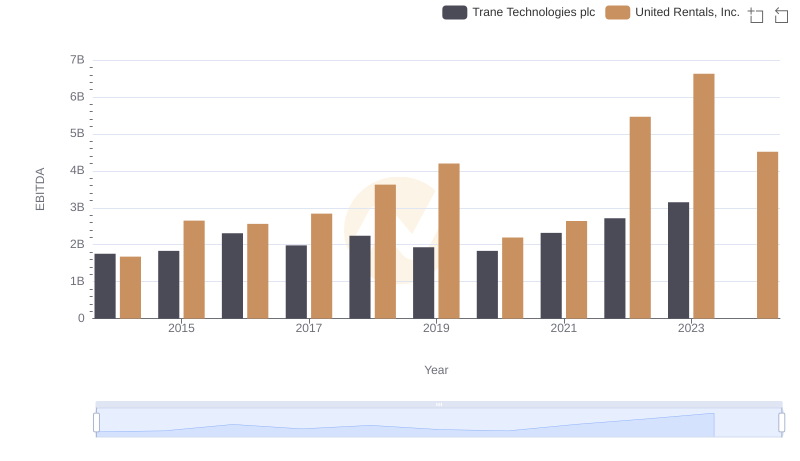
Comparative EBITDA Analysis: Trane Technologies plc vs United Rentals, Inc.
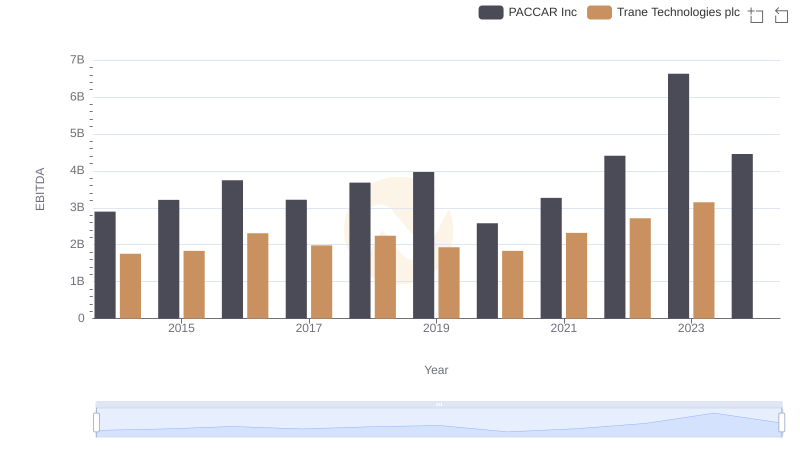
Trane Technologies plc vs PACCAR Inc: In-Depth EBITDA Performance Comparison
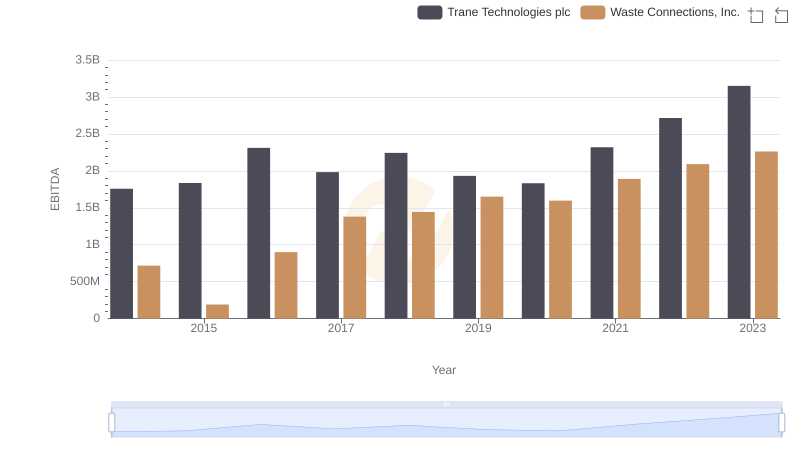
Trane Technologies plc and Waste Connections, Inc.: A Detailed Examination of EBITDA Performance
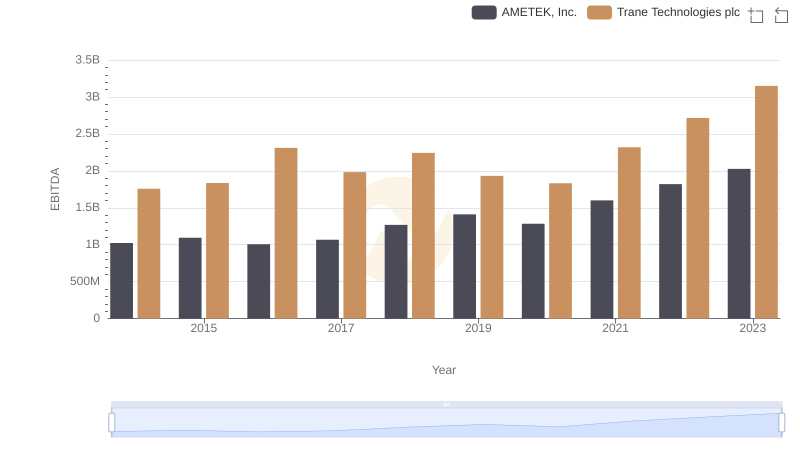
EBITDA Performance Review: Trane Technologies plc vs AMETEK, Inc.