| __timestamp | PACCAR Inc | Trane Technologies plc |
|---|---|---|
| Wednesday, January 1, 2014 | 2896200000 | 1757000000 |
| Thursday, January 1, 2015 | 3212900000 | 1835000000 |
| Friday, January 1, 2016 | 3745900000 | 2311000000 |
| Sunday, January 1, 2017 | 3215800000 | 1982500000 |
| Monday, January 1, 2018 | 3681700000 | 2242400000 |
| Tuesday, January 1, 2019 | 3969900000 | 1931200000 |
| Wednesday, January 1, 2020 | 2581000000 | 1831900000 |
| Friday, January 1, 2021 | 3268200000 | 2319200000 |
| Saturday, January 1, 2022 | 4407800000 | 2715500000 |
| Sunday, January 1, 2023 | 6626900000 | 3149900000 |
| Monday, January 1, 2024 | 4456800000 | 3859600000 |
Unlocking the unknown
In the ever-evolving landscape of industrial giants, Trane Technologies plc and PACCAR Inc. have showcased intriguing EBITDA trends over the past decade. From 2014 to 2023, PACCAR Inc. consistently outperformed, with a remarkable 70% increase in EBITDA, peaking at $6.63 billion in 2023. Meanwhile, Trane Technologies demonstrated steady growth, achieving a 79% rise, culminating in $3.15 billion in the same year.
Despite missing data for 2024, these trends highlight the resilience and strategic prowess of these industrial leaders.

Revenue Insights: Trane Technologies plc and PACCAR Inc Performance Compared
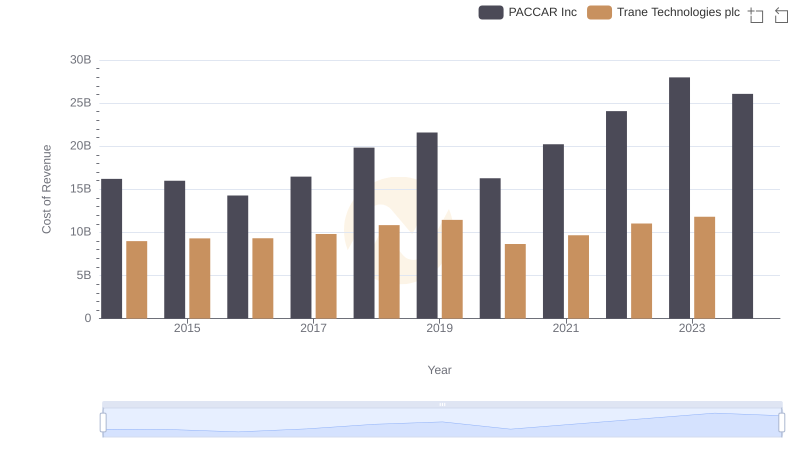
Cost Insights: Breaking Down Trane Technologies plc and PACCAR Inc's Expenses
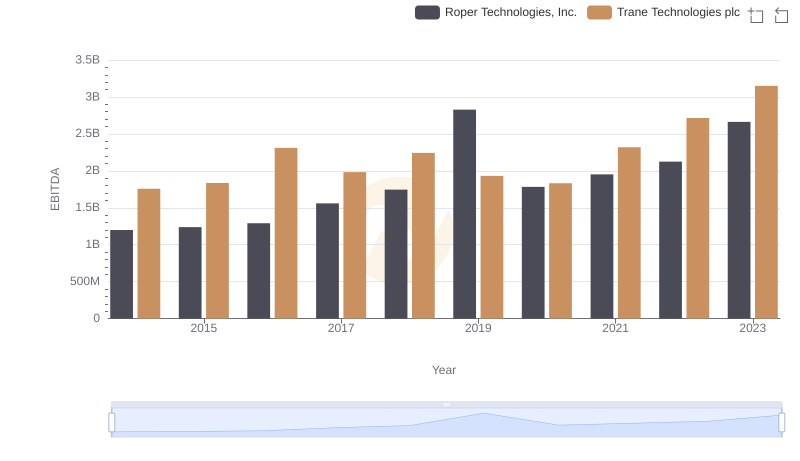
A Side-by-Side Analysis of EBITDA: Trane Technologies plc and Roper Technologies, Inc.
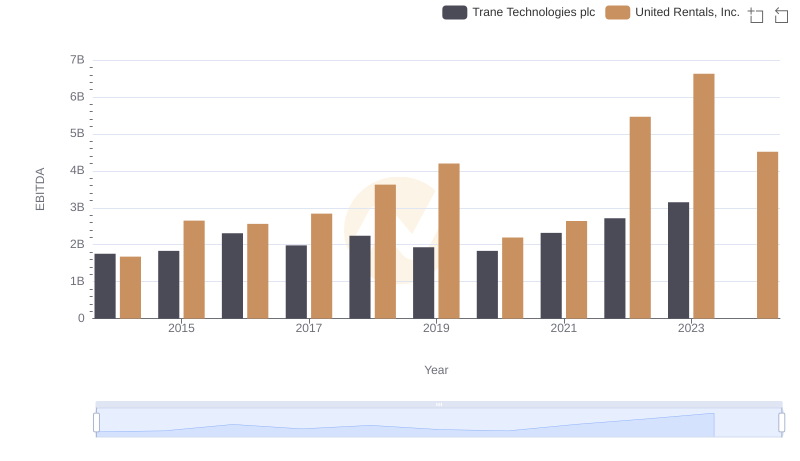
Comparative EBITDA Analysis: Trane Technologies plc vs United Rentals, Inc.
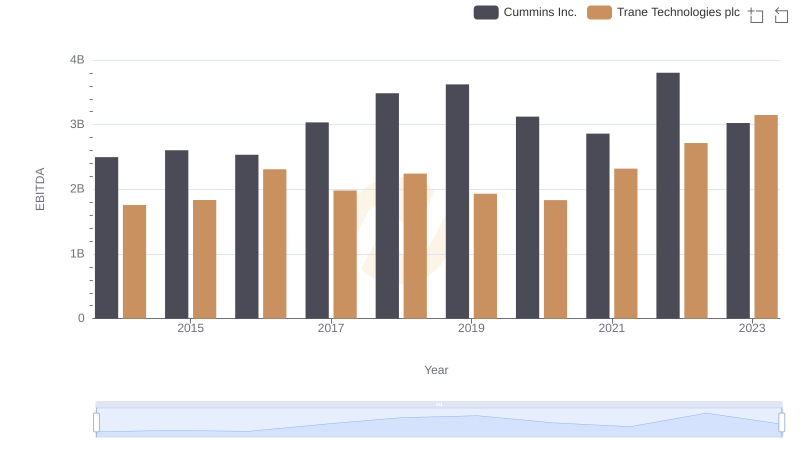
A Side-by-Side Analysis of EBITDA: Trane Technologies plc and Cummins Inc.
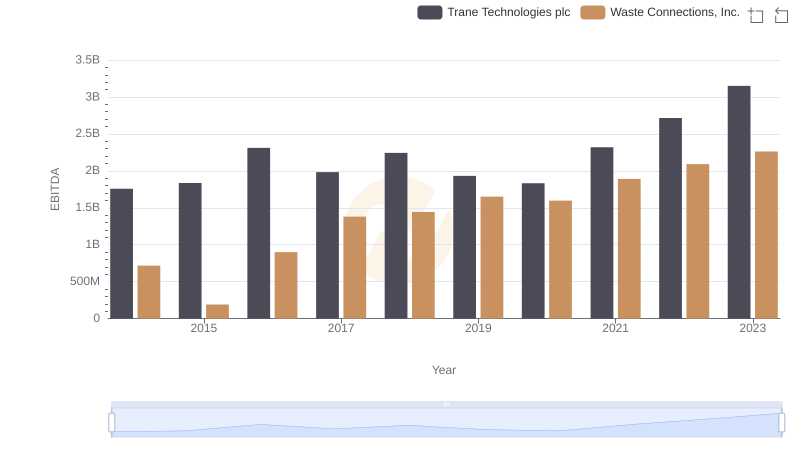
Trane Technologies plc and Waste Connections, Inc.: A Detailed Examination of EBITDA Performance