| __timestamp | Old Dominion Freight Line, Inc. | Verisk Analytics, Inc. |
|---|---|---|
| Wednesday, January 1, 2014 | 585590000 | 776000000 |
| Thursday, January 1, 2015 | 660570000 | 972500000 |
| Friday, January 1, 2016 | 671786000 | 985300000 |
| Sunday, January 1, 2017 | 783749000 | 1047800000 |
| Monday, January 1, 2018 | 1046059000 | 1145500000 |
| Tuesday, January 1, 2019 | 1078007000 | 1018900000 |
| Wednesday, January 1, 2020 | 1168149000 | 1393800000 |
| Friday, January 1, 2021 | 1651501000 | 1163700000 |
| Saturday, January 1, 2022 | 2118962000 | 1639800000 |
| Sunday, January 1, 2023 | 1972689000 | 1424100000 |
Data in motion
In the ever-evolving landscape of American business, two giants stand out for their impressive EBITDA growth over the past decade: Old Dominion Freight Line, Inc. and Verisk Analytics, Inc. From 2014 to 2023, these companies have demonstrated resilience and adaptability in their respective industries.
Old Dominion Freight Line, a leader in the freight and logistics sector, has seen its EBITDA grow by an astounding 237%, peaking in 2022. This growth reflects the company's strategic expansion and operational efficiency. Meanwhile, Verisk Analytics, a powerhouse in data analytics, experienced a 111% increase in EBITDA, showcasing its ability to leverage data-driven insights for sustained profitability.
Despite economic fluctuations, both companies have maintained a steady upward trajectory, with Old Dominion consistently outperforming Verisk in recent years. This comparative analysis highlights the dynamic nature of these industries and the strategic prowess of these market leaders.
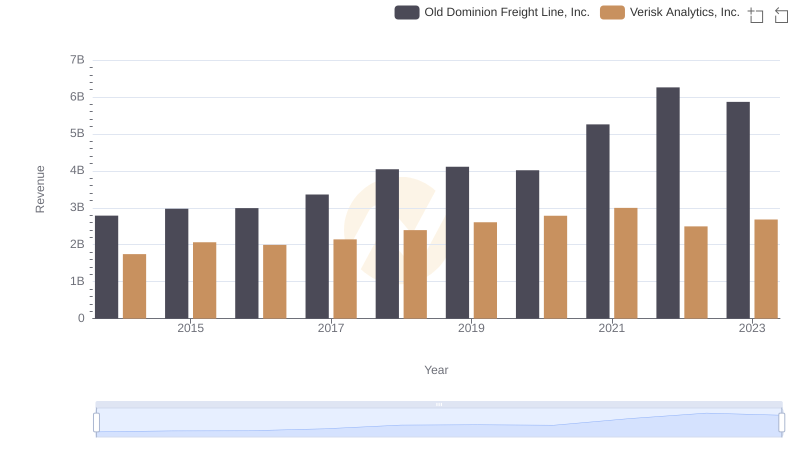
Old Dominion Freight Line, Inc. vs Verisk Analytics, Inc.: Examining Key Revenue Metrics
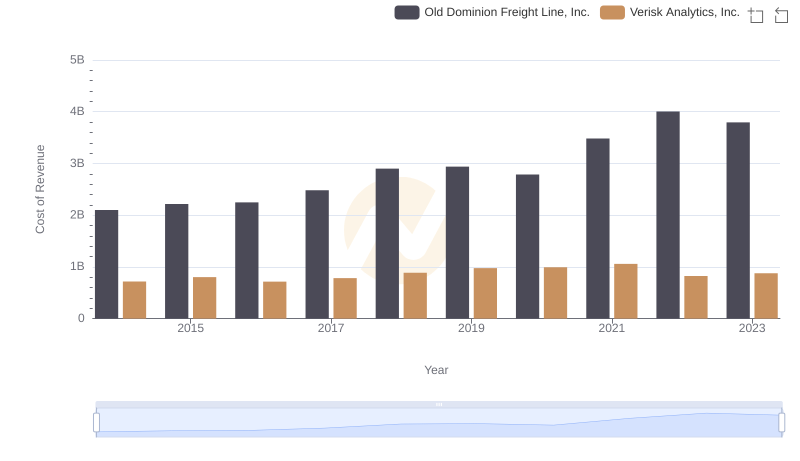
Cost of Revenue: Key Insights for Old Dominion Freight Line, Inc. and Verisk Analytics, Inc.
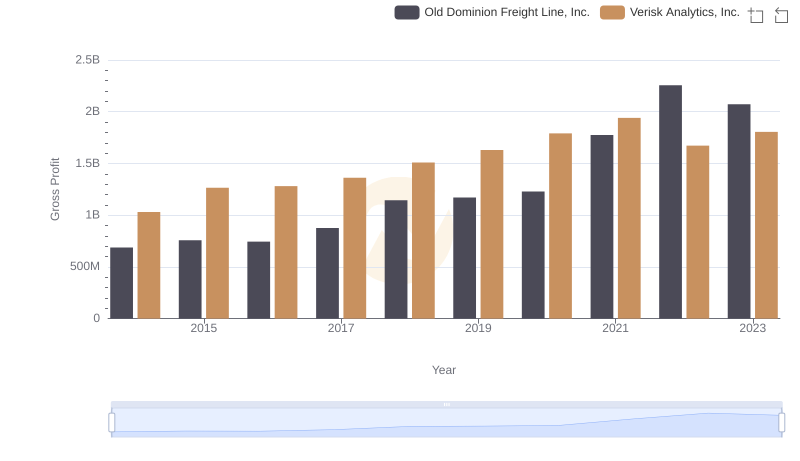
Gross Profit Analysis: Comparing Old Dominion Freight Line, Inc. and Verisk Analytics, Inc.
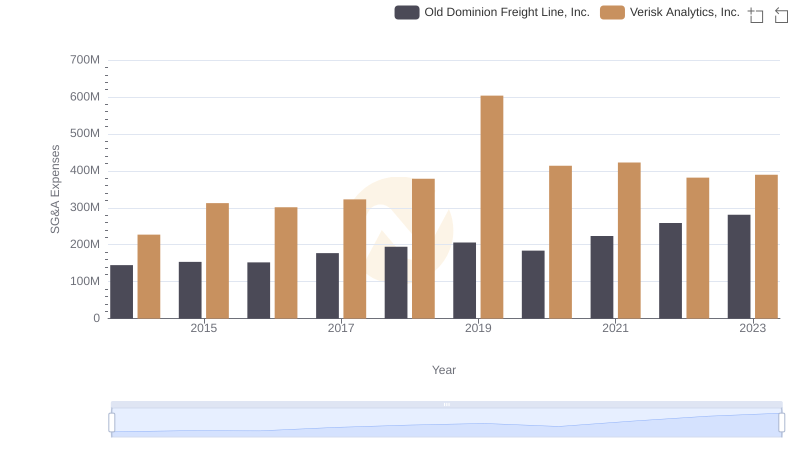
Operational Costs Compared: SG&A Analysis of Old Dominion Freight Line, Inc. and Verisk Analytics, Inc.
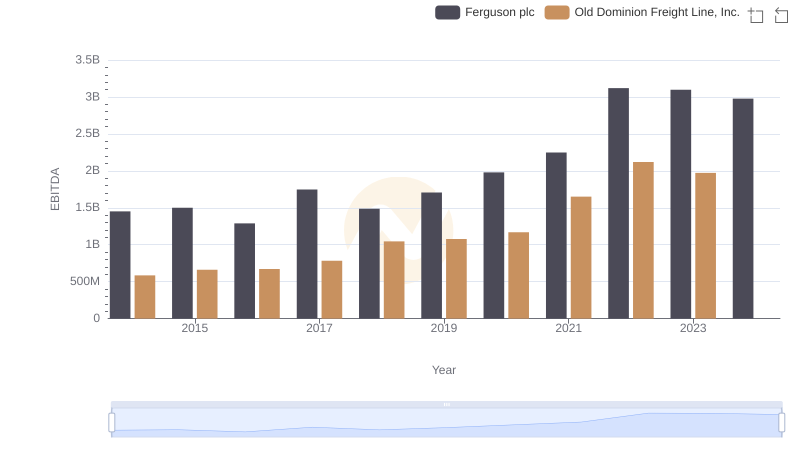
Old Dominion Freight Line, Inc. vs Ferguson plc: In-Depth EBITDA Performance Comparison
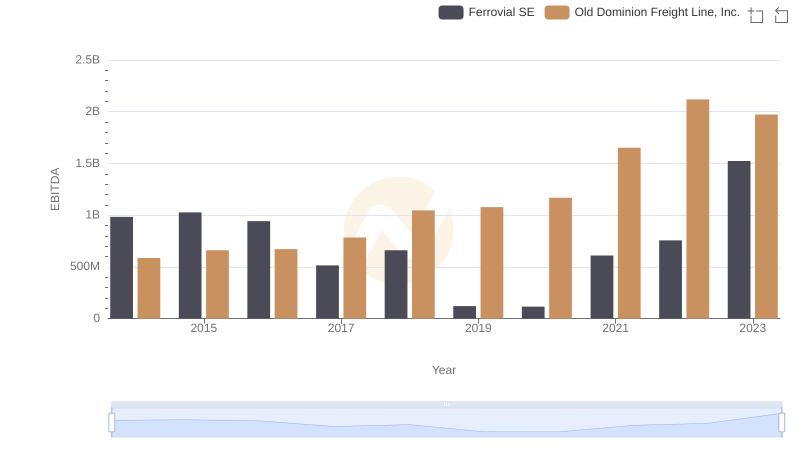
EBITDA Analysis: Evaluating Old Dominion Freight Line, Inc. Against Ferrovial SE
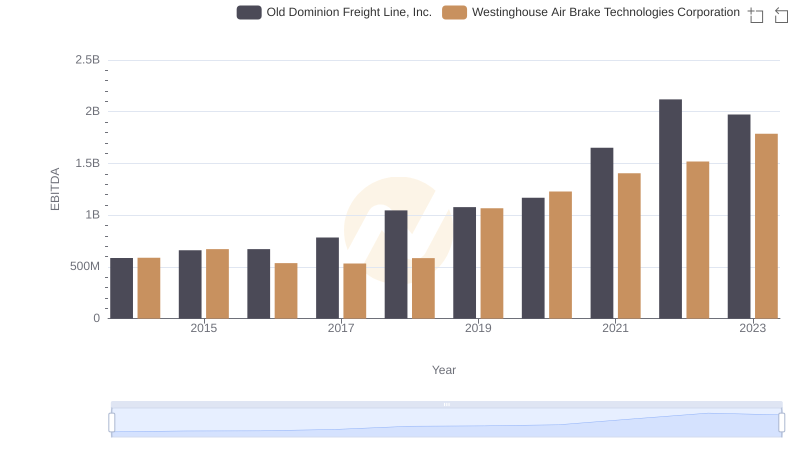
Old Dominion Freight Line, Inc. vs Westinghouse Air Brake Technologies Corporation: In-Depth EBITDA Performance Comparison
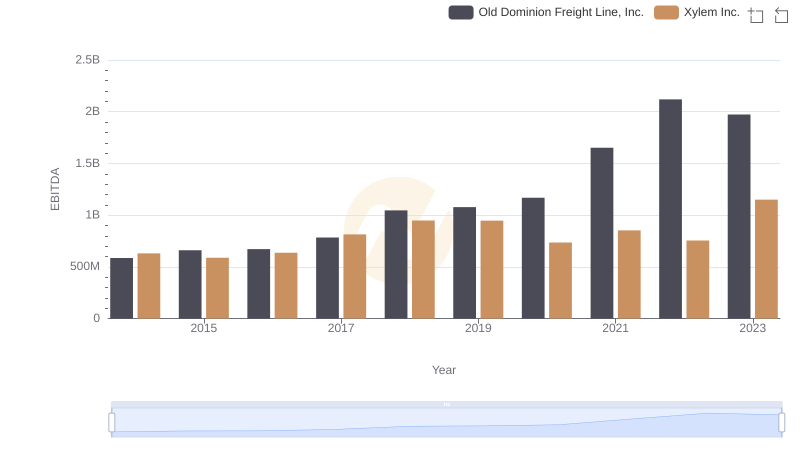
Old Dominion Freight Line, Inc. and Xylem Inc.: A Detailed Examination of EBITDA Performance
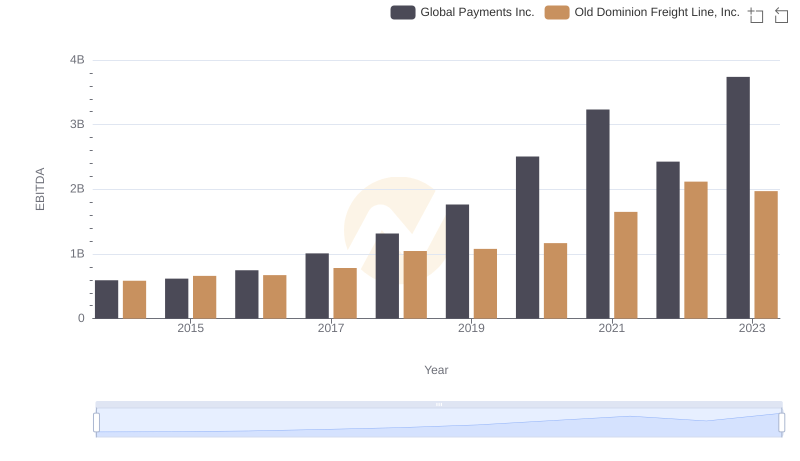
EBITDA Analysis: Evaluating Old Dominion Freight Line, Inc. Against Global Payments Inc.
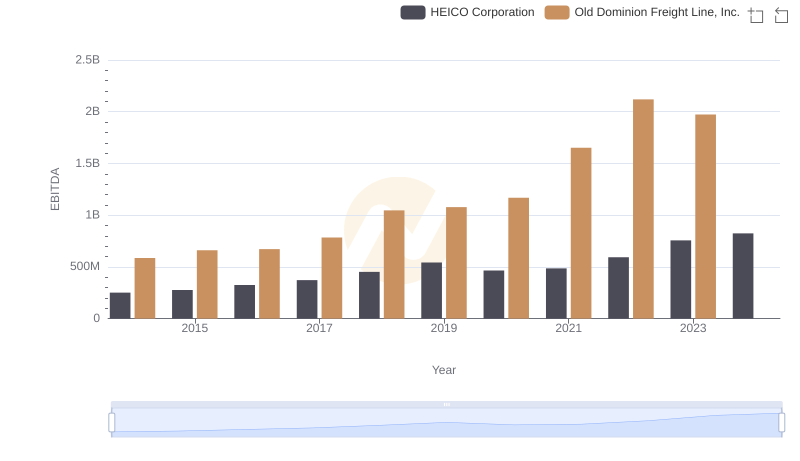
EBITDA Performance Review: Old Dominion Freight Line, Inc. vs HEICO Corporation