| __timestamp | Old Dominion Freight Line, Inc. | Verisk Analytics, Inc. |
|---|---|---|
| Wednesday, January 1, 2014 | 2100409000 | 716598000 |
| Thursday, January 1, 2015 | 2214943000 | 803274000 |
| Friday, January 1, 2016 | 2246890000 | 714400000 |
| Sunday, January 1, 2017 | 2482732000 | 783800000 |
| Monday, January 1, 2018 | 2899452000 | 886200000 |
| Tuesday, January 1, 2019 | 2938895000 | 976800000 |
| Wednesday, January 1, 2020 | 2786531000 | 993900000 |
| Friday, January 1, 2021 | 3481268000 | 1057800000 |
| Saturday, January 1, 2022 | 4003951000 | 824600000 |
| Sunday, January 1, 2023 | 3793953000 | 876500000 |
Unveiling the hidden dimensions of data
In the ever-evolving landscape of American business, understanding cost structures is crucial. From 2014 to 2023, Old Dominion Freight Line, Inc. and Verisk Analytics, Inc. have shown distinct trajectories in their cost of revenue. Old Dominion Freight Line, a leader in the freight industry, saw its cost of revenue grow by approximately 80% over this period, peaking in 2022. This reflects the company's expansion and increased operational scale. In contrast, Verisk Analytics, a data analytics powerhouse, experienced a more modest increase of around 22%, with a peak in 2021. This suggests a stable cost structure, likely due to its tech-driven business model. These insights highlight the diverse strategies and market dynamics influencing these companies. As businesses navigate the complexities of cost management, these trends offer valuable lessons in balancing growth and efficiency.
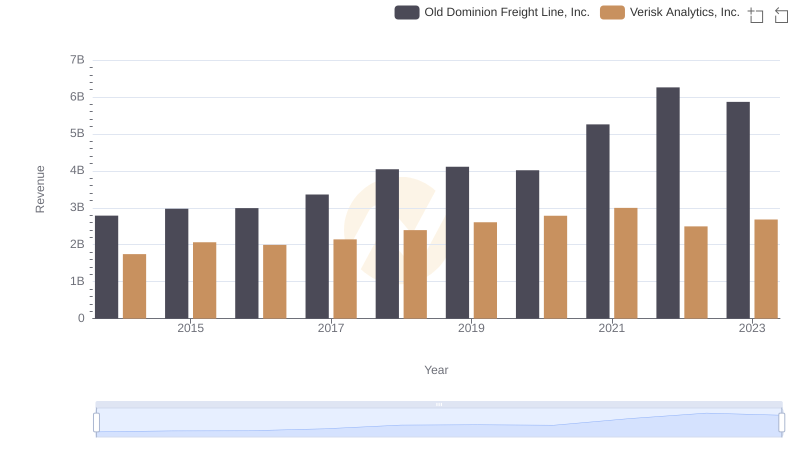
Old Dominion Freight Line, Inc. vs Verisk Analytics, Inc.: Examining Key Revenue Metrics
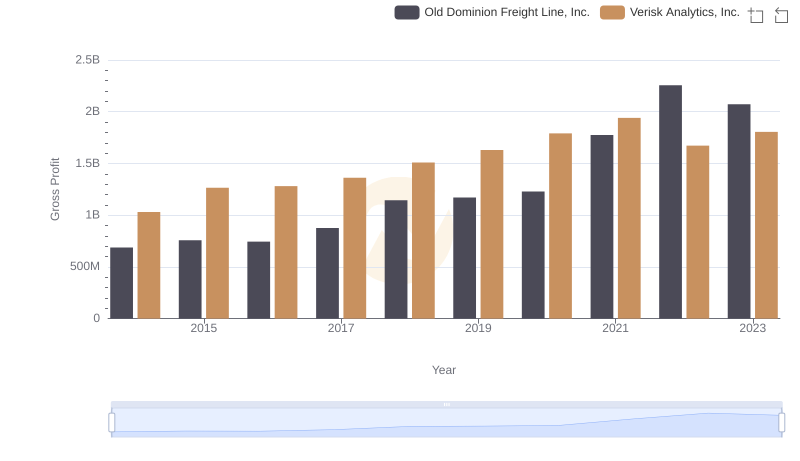
Gross Profit Analysis: Comparing Old Dominion Freight Line, Inc. and Verisk Analytics, Inc.
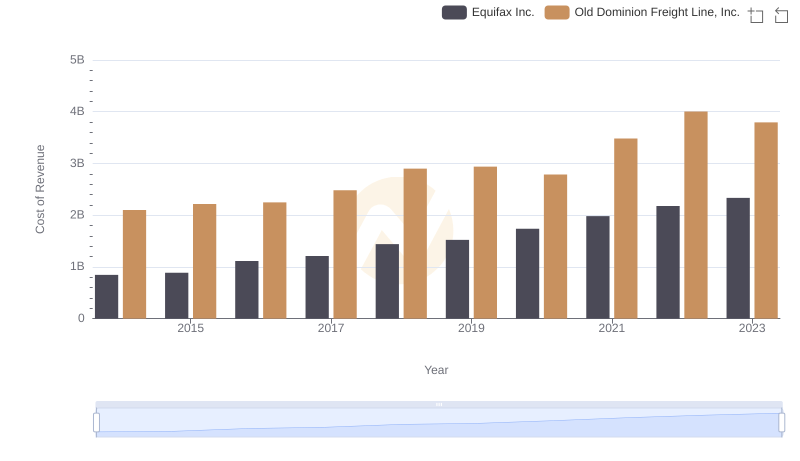
Cost of Revenue: Key Insights for Old Dominion Freight Line, Inc. and Equifax Inc.
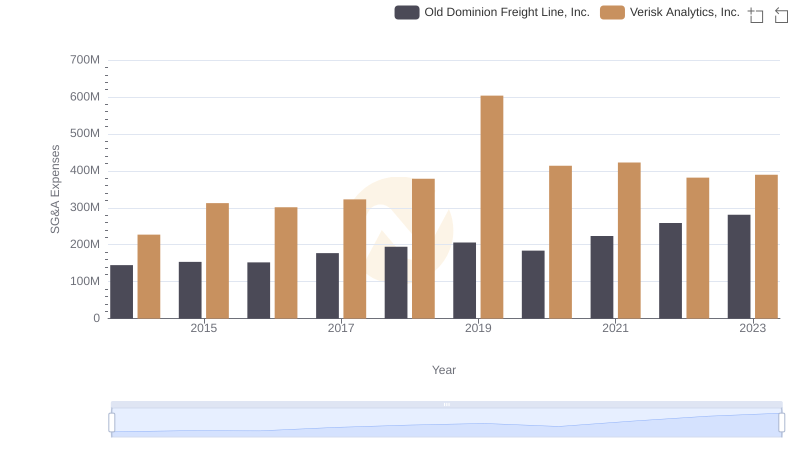
Operational Costs Compared: SG&A Analysis of Old Dominion Freight Line, Inc. and Verisk Analytics, Inc.
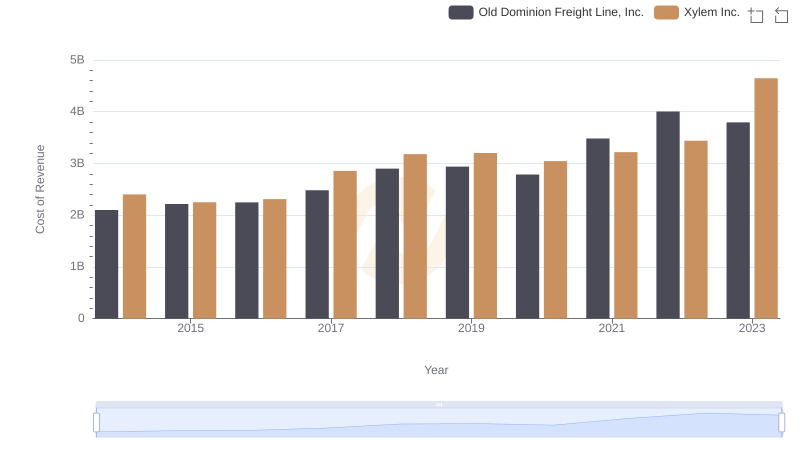
Cost Insights: Breaking Down Old Dominion Freight Line, Inc. and Xylem Inc.'s Expenses
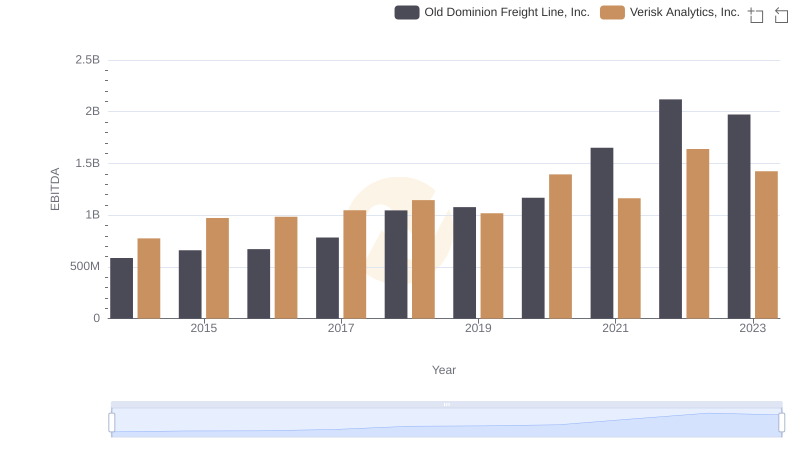
Comparative EBITDA Analysis: Old Dominion Freight Line, Inc. vs Verisk Analytics, Inc.
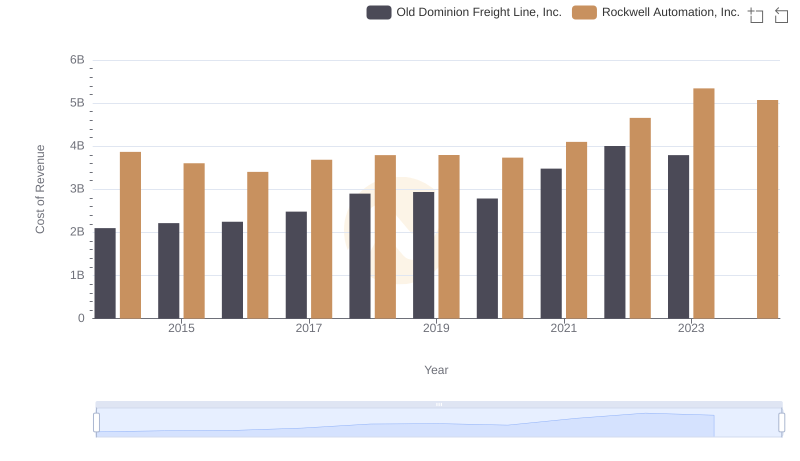
Comparing Cost of Revenue Efficiency: Old Dominion Freight Line, Inc. vs Rockwell Automation, Inc.
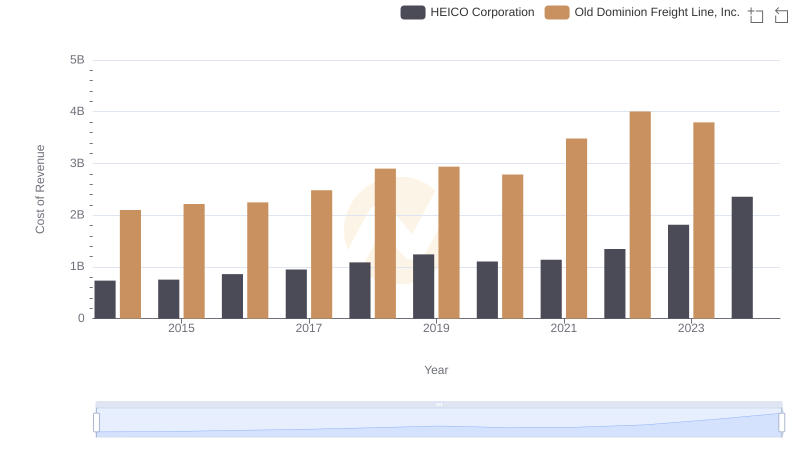
Cost of Revenue Trends: Old Dominion Freight Line, Inc. vs HEICO Corporation