| __timestamp | Infosys Limited | SS&C Technologies Holdings, Inc. |
|---|---|---|
| Wednesday, January 1, 2014 | 5374000000 | 410731000 |
| Thursday, January 1, 2015 | 5950000000 | 532350000 |
| Friday, January 1, 2016 | 6446000000 | 800489000 |
| Sunday, January 1, 2017 | 7001000000 | 886425000 |
| Monday, January 1, 2018 | 7687000000 | 2051100000 |
| Tuesday, January 1, 2019 | 8552000000 | 2611700000 |
| Wednesday, January 1, 2020 | 8828000000 | 2574100000 |
| Friday, January 1, 2021 | 10996000000 | 2641700000 |
| Saturday, January 1, 2022 | 12709000000 | 2767700000 |
| Sunday, January 1, 2023 | 13096000000 | 2851000000 |
| Monday, January 1, 2024 | 3018400000 |
Unleashing the power of data
In the ever-evolving landscape of global technology, Infosys Limited and SS&C Technologies Holdings, Inc. stand as prominent players. Over the past decade, from 2014 to 2023, these companies have showcased distinct trajectories in their cost of revenue. Infosys, a titan in the IT services sector, has seen its cost of revenue grow by approximately 144%, from $5.4 billion in 2014 to $13.1 billion in 2023. This growth reflects its expanding global footprint and increasing service offerings.
Conversely, SS&C Technologies, a leader in financial services software, has experienced a more modest increase of around 594%, from $410 million to $2.9 billion over the same period. This growth underscores its strategic acquisitions and focus on niche markets.
These trends highlight the diverse strategies and market dynamics influencing the cost structures of these industry giants.
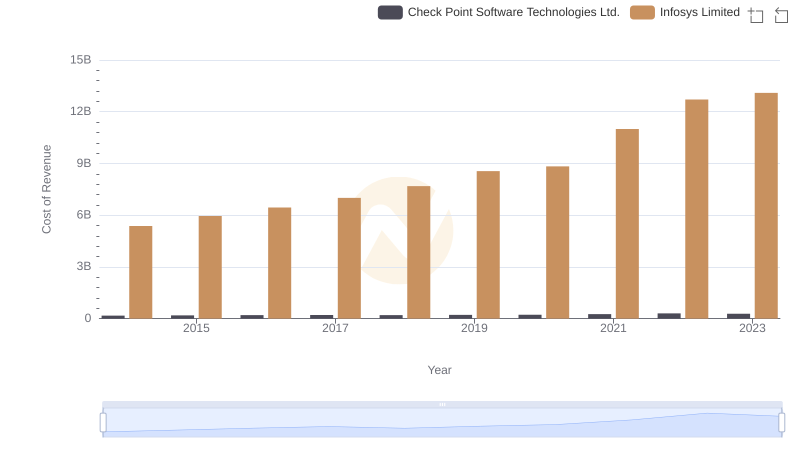
Cost of Revenue Comparison: Infosys Limited vs Check Point Software Technologies Ltd.
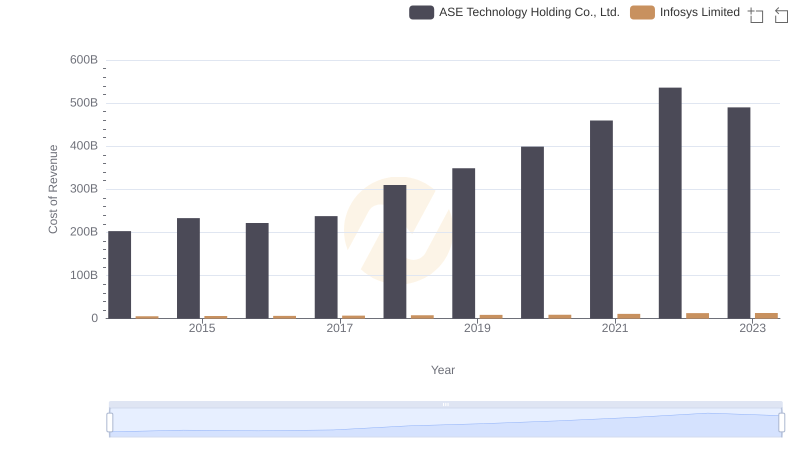
Cost of Revenue: Key Insights for Infosys Limited and ASE Technology Holding Co., Ltd.
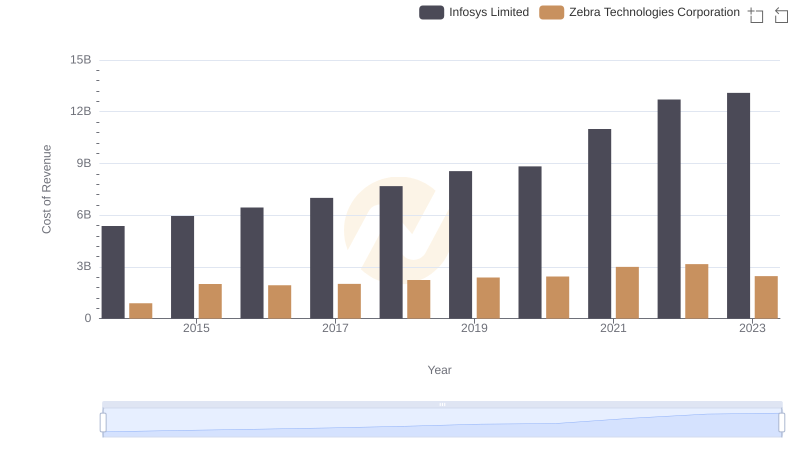
Cost Insights: Breaking Down Infosys Limited and Zebra Technologies Corporation's Expenses
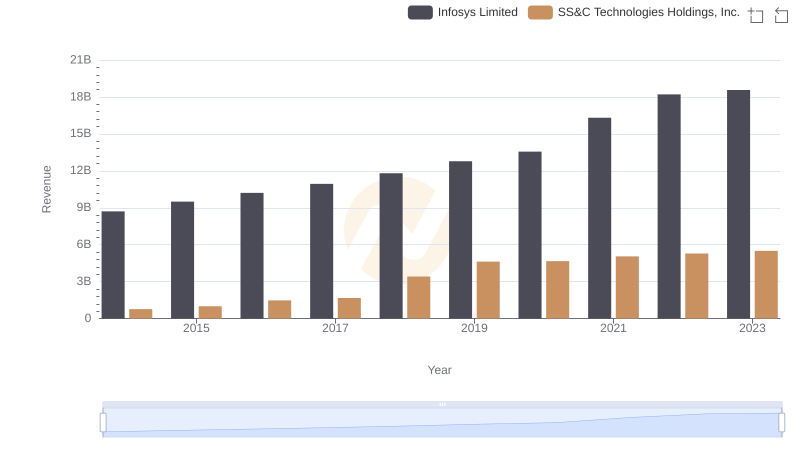
Infosys Limited vs SS&C Technologies Holdings, Inc.: Examining Key Revenue Metrics
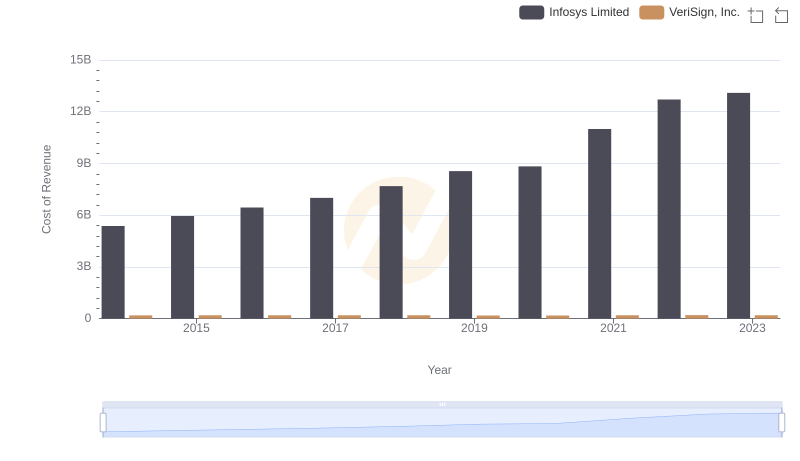
Cost of Revenue: Key Insights for Infosys Limited and VeriSign, Inc.
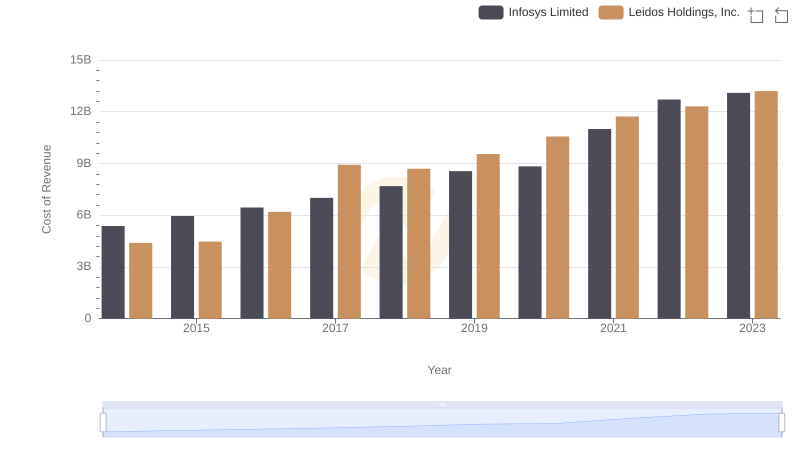
Cost of Revenue: Key Insights for Infosys Limited and Leidos Holdings, Inc.
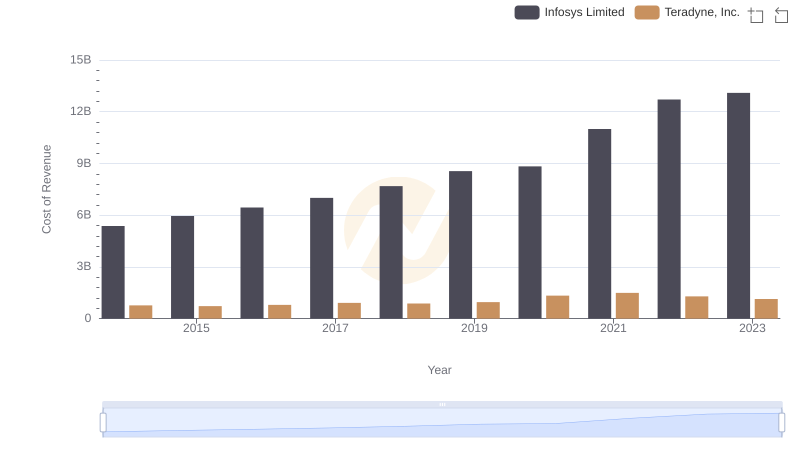
Analyzing Cost of Revenue: Infosys Limited and Teradyne, Inc.
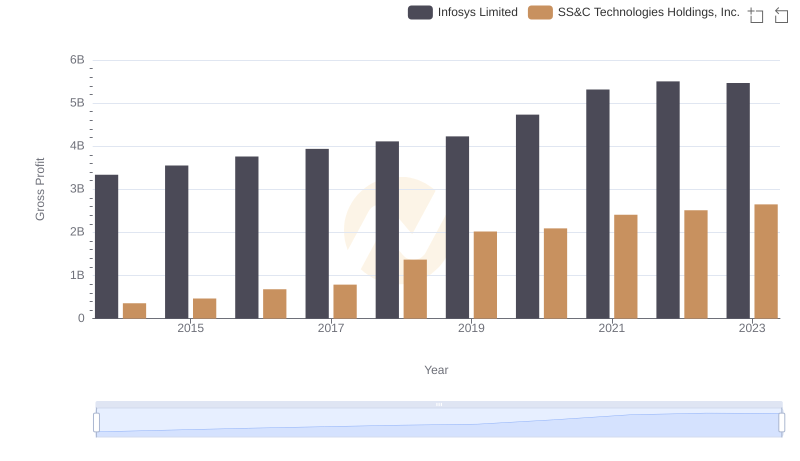
Gross Profit Comparison: Infosys Limited and SS&C Technologies Holdings, Inc. Trends
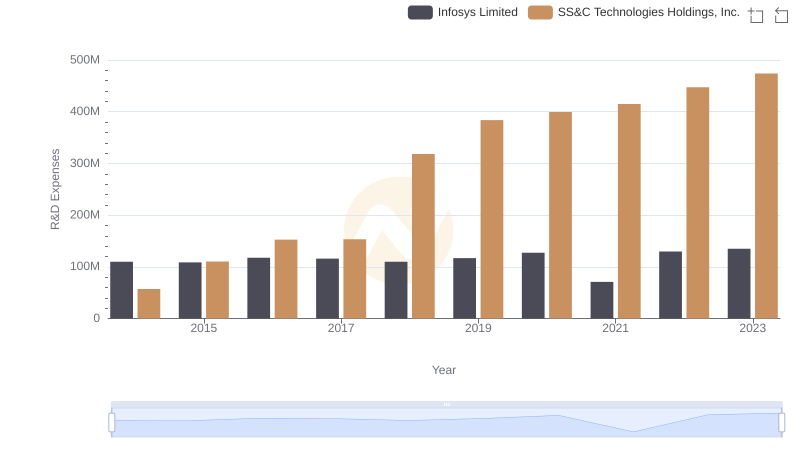
R&D Spending Showdown: Infosys Limited vs SS&C Technologies Holdings, Inc.

Infosys Limited vs Trimble Inc.: Efficiency in Cost of Revenue Explored
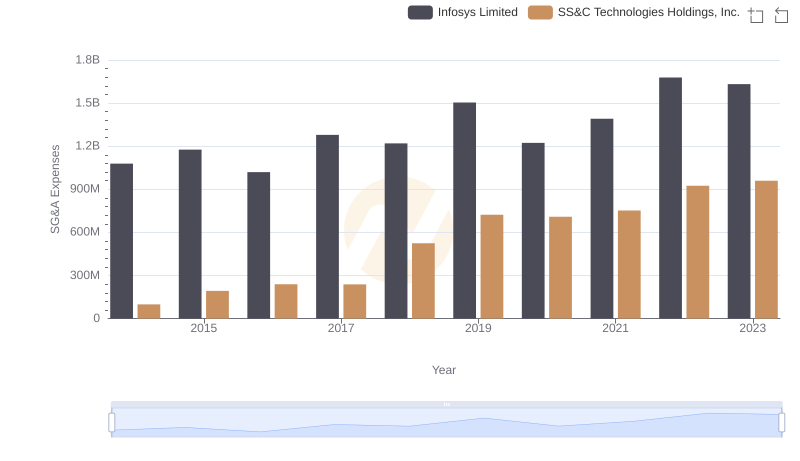
Breaking Down SG&A Expenses: Infosys Limited vs SS&C Technologies Holdings, Inc.
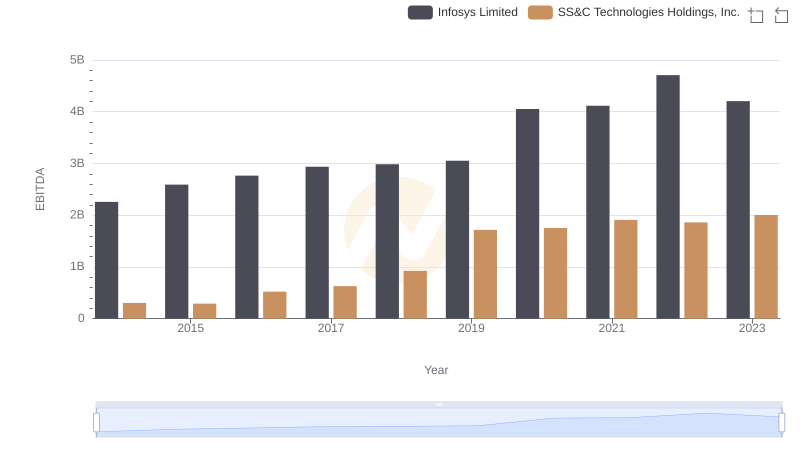
Comparative EBITDA Analysis: Infosys Limited vs SS&C Technologies Holdings, Inc.