| __timestamp | Infosys Limited | SS&C Technologies Holdings, Inc. |
|---|---|---|
| Wednesday, January 1, 2014 | 1079000000 | 99471000 |
| Thursday, January 1, 2015 | 1176000000 | 192782000 |
| Friday, January 1, 2016 | 1020000000 | 239563000 |
| Sunday, January 1, 2017 | 1279000000 | 238623000 |
| Monday, January 1, 2018 | 1220000000 | 524900000 |
| Tuesday, January 1, 2019 | 1504000000 | 723100000 |
| Wednesday, January 1, 2020 | 1223000000 | 708600000 |
| Friday, January 1, 2021 | 1391000000 | 752100000 |
| Saturday, January 1, 2022 | 1678000000 | 925100000 |
| Sunday, January 1, 2023 | 1632000000 | 959700000 |
| Monday, January 1, 2024 | 1002400000 |
Data in motion
In the ever-evolving landscape of global technology, understanding the financial dynamics of industry leaders is crucial. This analysis delves into the Selling, General, and Administrative (SG&A) expenses of two prominent companies: Infosys Limited and SS&C Technologies Holdings, Inc., from 2014 to 2023.
Infosys Limited, a titan in the IT services sector, has consistently demonstrated robust financial management. Over the past decade, its SG&A expenses have grown by approximately 51%, peaking in 2022. This growth reflects strategic investments in global expansion and innovation.
Conversely, SS&C Technologies Holdings, Inc., a leader in financial services software, has seen its SG&A expenses surge by nearly 864% during the same period. This dramatic increase underscores its aggressive acquisition strategy and market penetration efforts.
This comparative insight highlights the diverse strategies employed by these companies to navigate the competitive tech landscape.
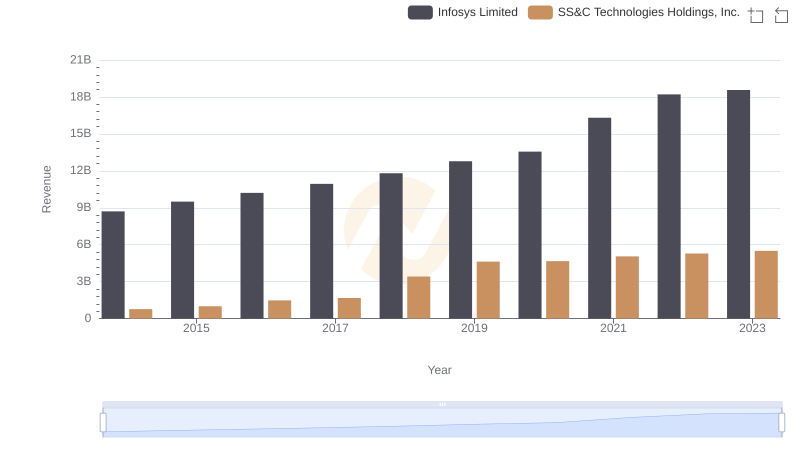
Infosys Limited vs SS&C Technologies Holdings, Inc.: Examining Key Revenue Metrics
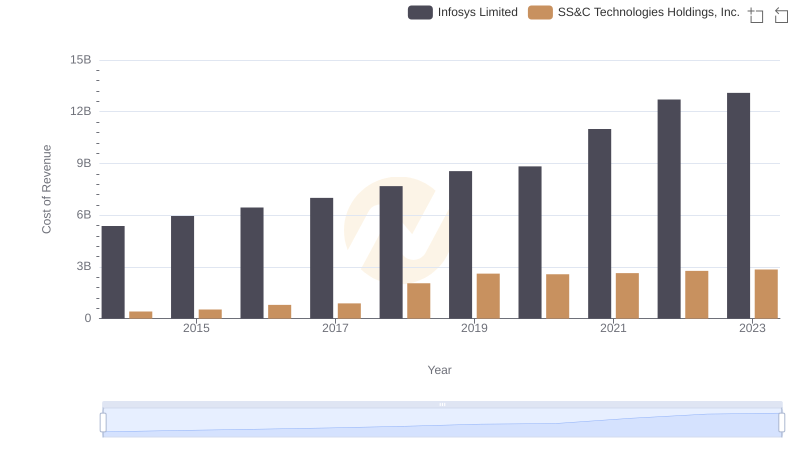
Cost of Revenue Comparison: Infosys Limited vs SS&C Technologies Holdings, Inc.
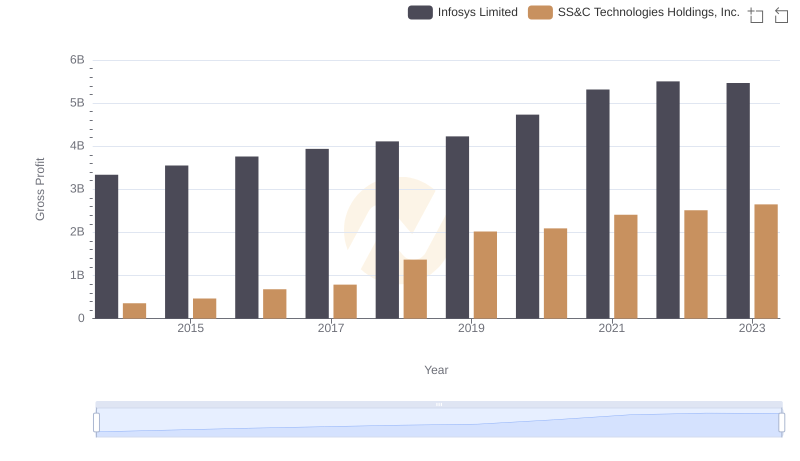
Gross Profit Comparison: Infosys Limited and SS&C Technologies Holdings, Inc. Trends
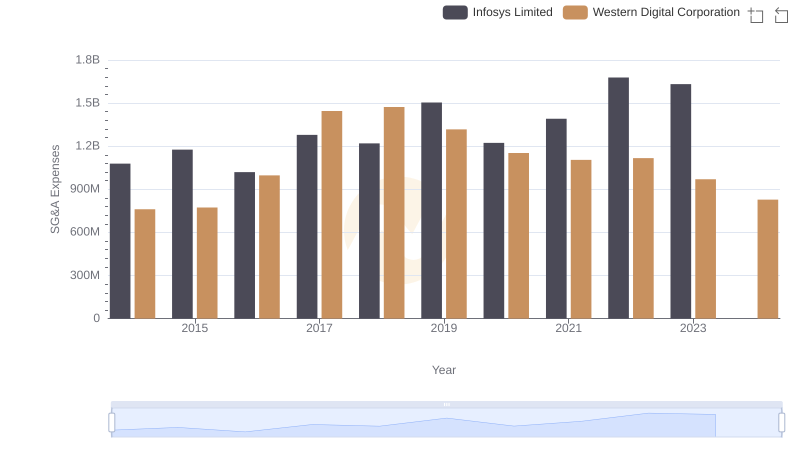
Who Optimizes SG&A Costs Better? Infosys Limited or Western Digital Corporation
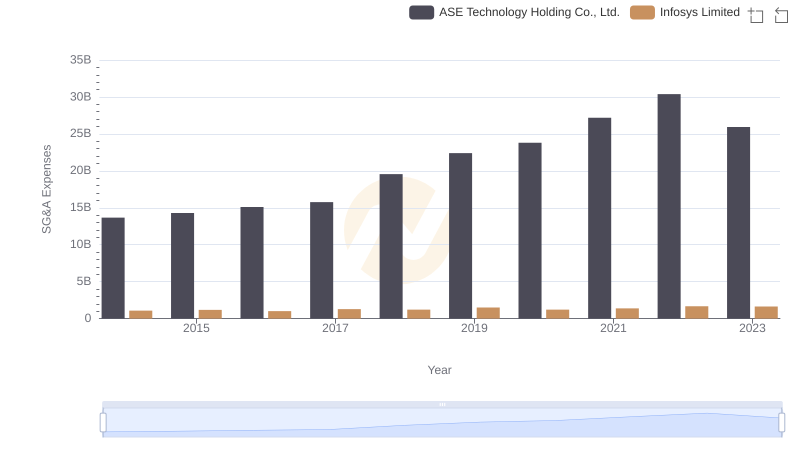
Selling, General, and Administrative Costs: Infosys Limited vs ASE Technology Holding Co., Ltd.
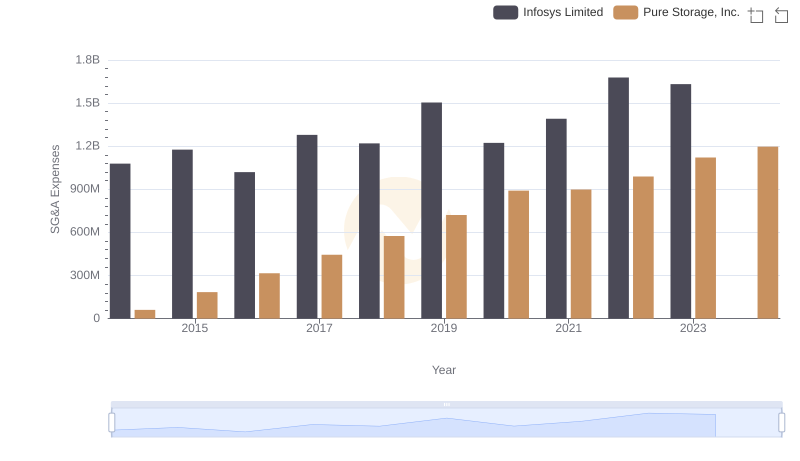
Infosys Limited and Pure Storage, Inc.: SG&A Spending Patterns Compared
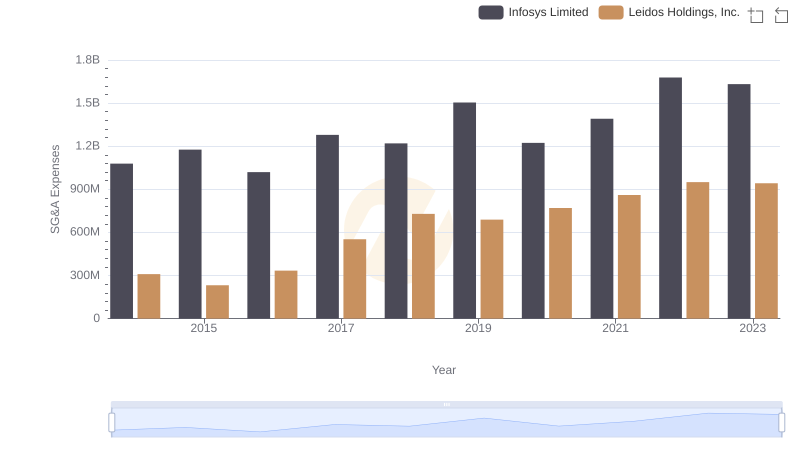
SG&A Efficiency Analysis: Comparing Infosys Limited and Leidos Holdings, Inc.
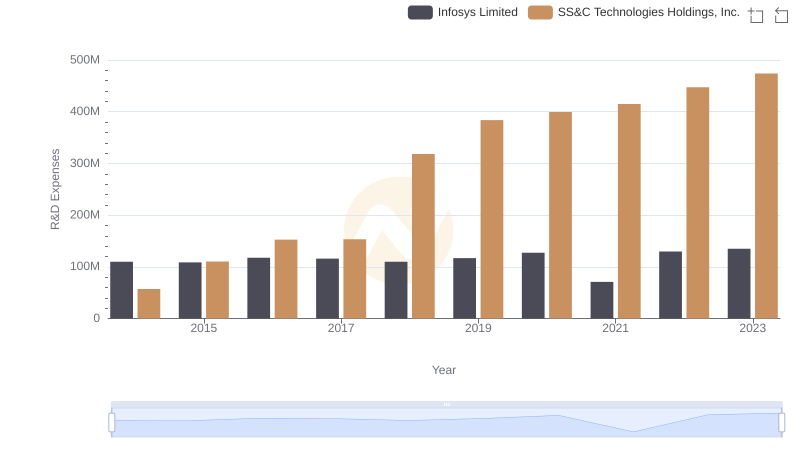
R&D Spending Showdown: Infosys Limited vs SS&C Technologies Holdings, Inc.
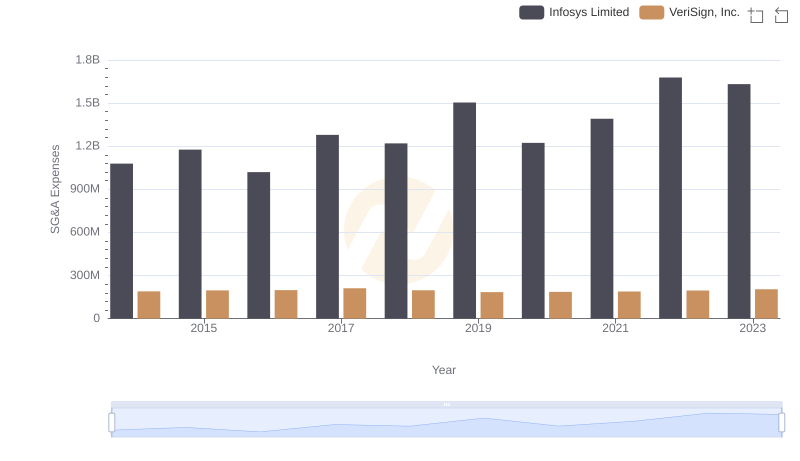
Cost Management Insights: SG&A Expenses for Infosys Limited and VeriSign, Inc.

Breaking Down SG&A Expenses: Infosys Limited vs Teradyne, Inc.
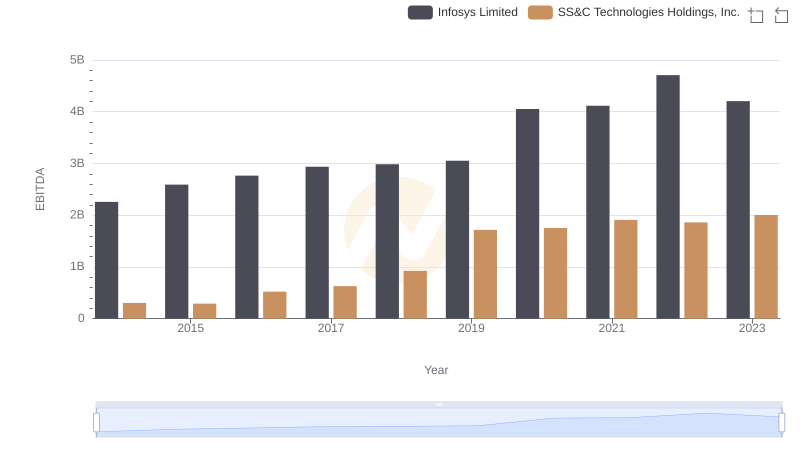
Comparative EBITDA Analysis: Infosys Limited vs SS&C Technologies Holdings, Inc.
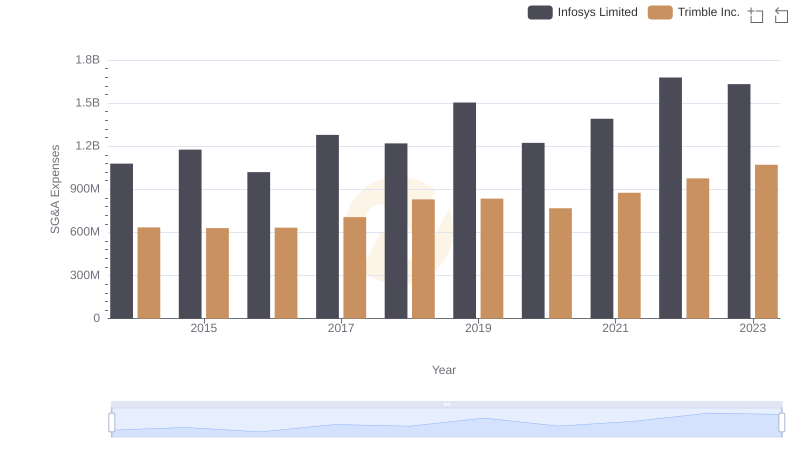
SG&A Efficiency Analysis: Comparing Infosys Limited and Trimble Inc.