| __timestamp | Cadence Design Systems, Inc. | Cisco Systems, Inc. |
|---|---|---|
| Wednesday, January 1, 2014 | 1357226000 | 27769000000 |
| Thursday, January 1, 2015 | 1463638000 | 29681000000 |
| Friday, January 1, 2016 | 1559591000 | 30960000000 |
| Sunday, January 1, 2017 | 1705642000 | 30224000000 |
| Monday, January 1, 2018 | 1879275000 | 30606000000 |
| Tuesday, January 1, 2019 | 2069962000 | 32666000000 |
| Wednesday, January 1, 2020 | 2377393000 | 31683000000 |
| Friday, January 1, 2021 | 2681238000 | 31894000000 |
| Saturday, January 1, 2022 | 3190095000 | 32248000000 |
| Sunday, January 1, 2023 | 3654945000 | 35753000000 |
| Monday, January 1, 2024 | 4430362000 | 34828000000 |
Igniting the spark of knowledge
In the ever-evolving tech industry, understanding financial performance is crucial. This analysis compares the gross profit trends of two giants: Cisco Systems, Inc. and Cadence Design Systems, Inc., from 2014 to 2023. Cisco, a leader in networking, consistently outperformed Cadence, a pioneer in electronic design automation, with gross profits averaging around $31.7 billion annually. Cadence, however, showcased impressive growth, with its gross profit increasing by approximately 169% over the decade, from $1.36 billion in 2014 to $3.65 billion in 2023. This growth highlights Cadence's strategic advancements in the tech sector. Notably, Cisco's gross profit peaked in 2023 at $35.75 billion, reflecting its robust market position. The data for 2024 is incomplete, indicating potential shifts in the coming year. This comparison underscores the dynamic nature of the tech industry and the importance of strategic growth.
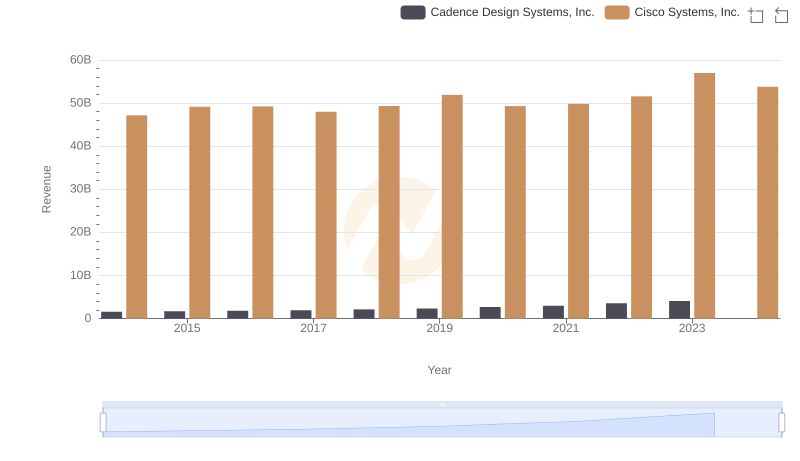
Cisco Systems, Inc. or Cadence Design Systems, Inc.: Who Leads in Yearly Revenue?
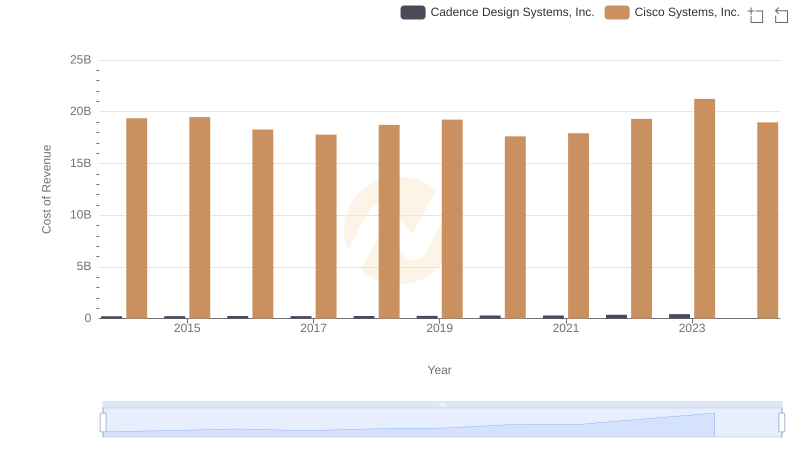
Cost of Revenue: Key Insights for Cisco Systems, Inc. and Cadence Design Systems, Inc.
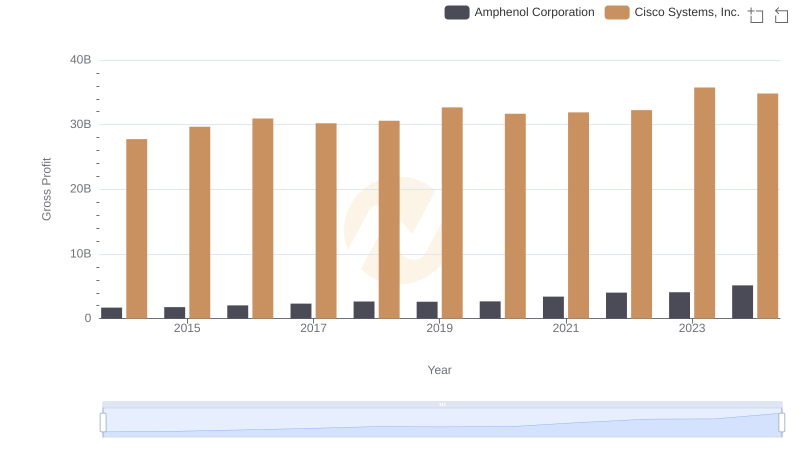
Key Insights on Gross Profit: Cisco Systems, Inc. vs Amphenol Corporation
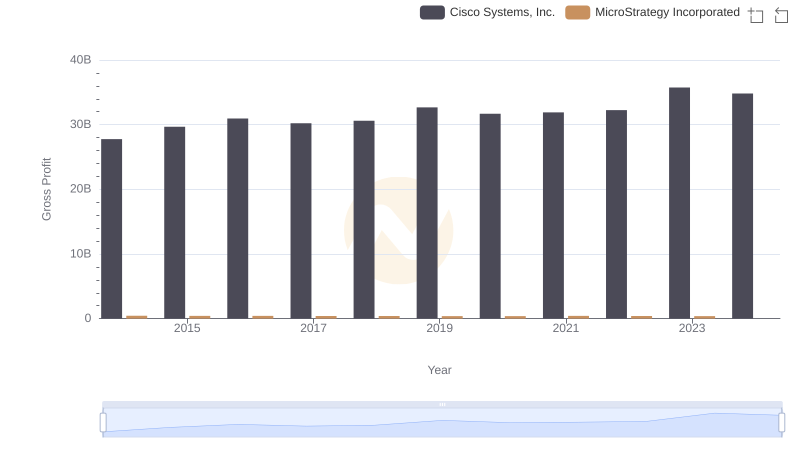
Cisco Systems, Inc. vs MicroStrategy Incorporated: A Gross Profit Performance Breakdown
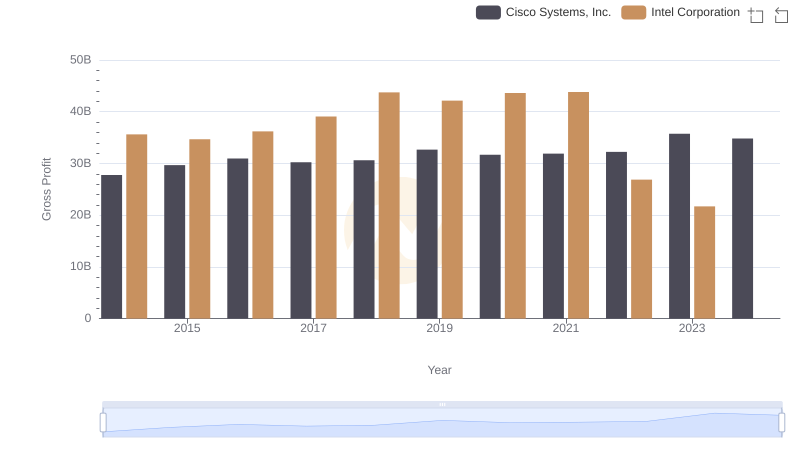
Cisco Systems, Inc. vs Intel Corporation: A Gross Profit Performance Breakdown
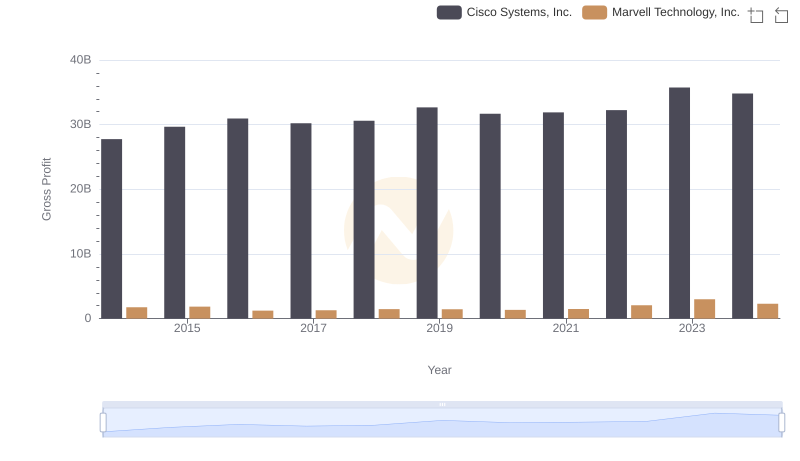
Cisco Systems, Inc. vs Marvell Technology, Inc.: A Gross Profit Performance Breakdown

Research and Development Investment: Cisco Systems, Inc. vs Cadence Design Systems, Inc.
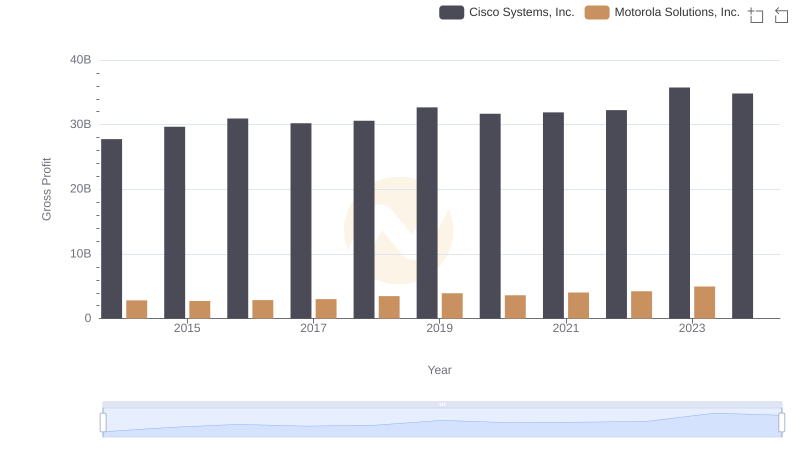
Cisco Systems, Inc. and Motorola Solutions, Inc.: A Detailed Gross Profit Analysis

Cisco Systems, Inc. vs Synopsys, Inc.: A Gross Profit Performance Breakdown
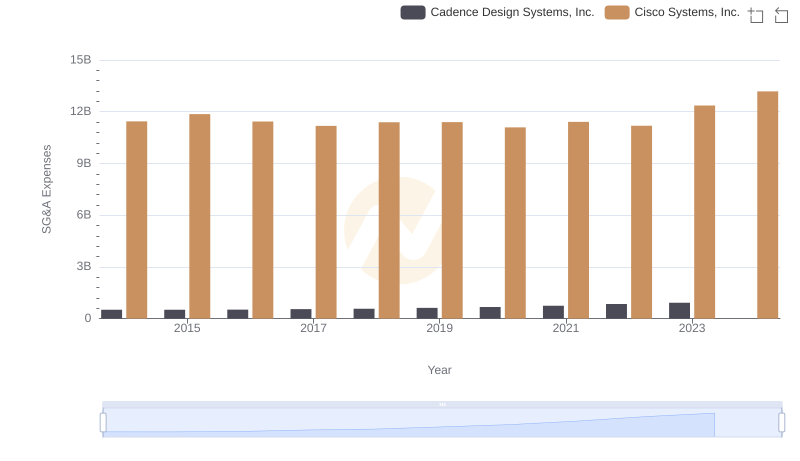
Cisco Systems, Inc. vs Cadence Design Systems, Inc.: SG&A Expense Trends
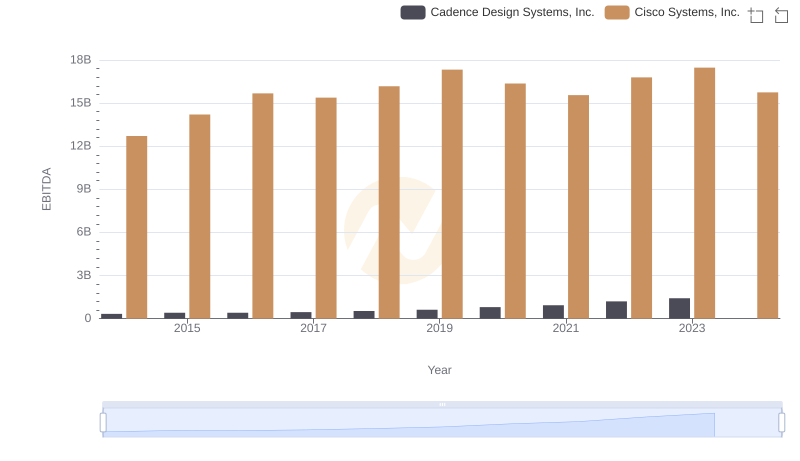
Professional EBITDA Benchmarking: Cisco Systems, Inc. vs Cadence Design Systems, Inc.